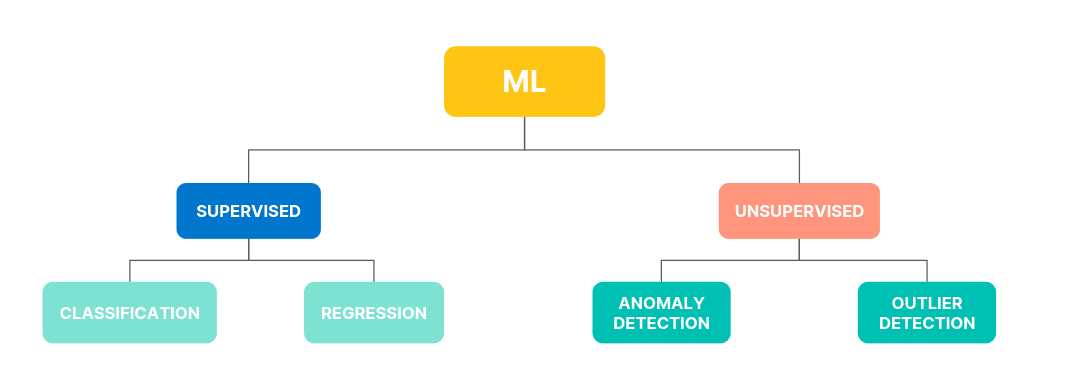
- The Elastic Stack supports several data analysis use cases using supervised and unsupervised ML
- anomaly detection
- forecasting
- language identification
- The goal is to operationalize and simplify data science
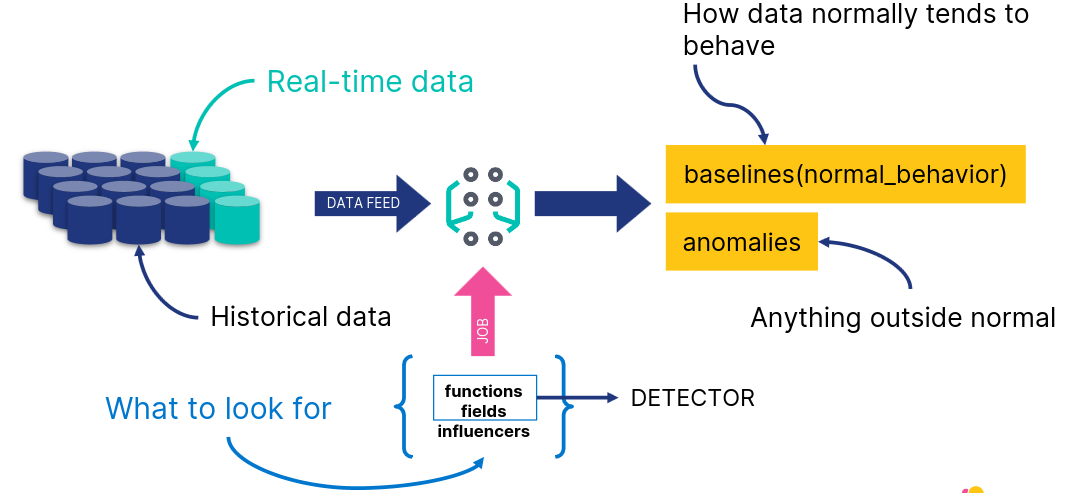
- Identify patterns and unusual behavior in historical and streaming time series data
- Choose a job type from the available wizards
- Define the time range
- Choose field and metric
- Define bucket span
- Create job and view results
- Snapshot saved frequently to an index
- Revert to a snapshot in case of
- system failure
- undesirable model change due to one off events
- Given a model, predict future behavior
- After you have created a model of your data, and detected anomalies, you may want to:
- analyze and enrich the results
- share your results within a Dashboard
- Single Metric Viewer
- Display single time series
- Chart of Actual vs. Expected
- Anomaly Explorer
- Swimlanes for different job results
- Overall score
- Shared influencers
- When you run a machine learning job, its algorithm is trying to find anomalies - but it doesn’t know what the data itself is about
- User annotations offer a way to augment the results with the knowledge you as a user have about the data
- Based on the eCommerce orders, which customers are unusual?
- customers who show fraudulent behavior
- “VIP” customers who spend much more than others
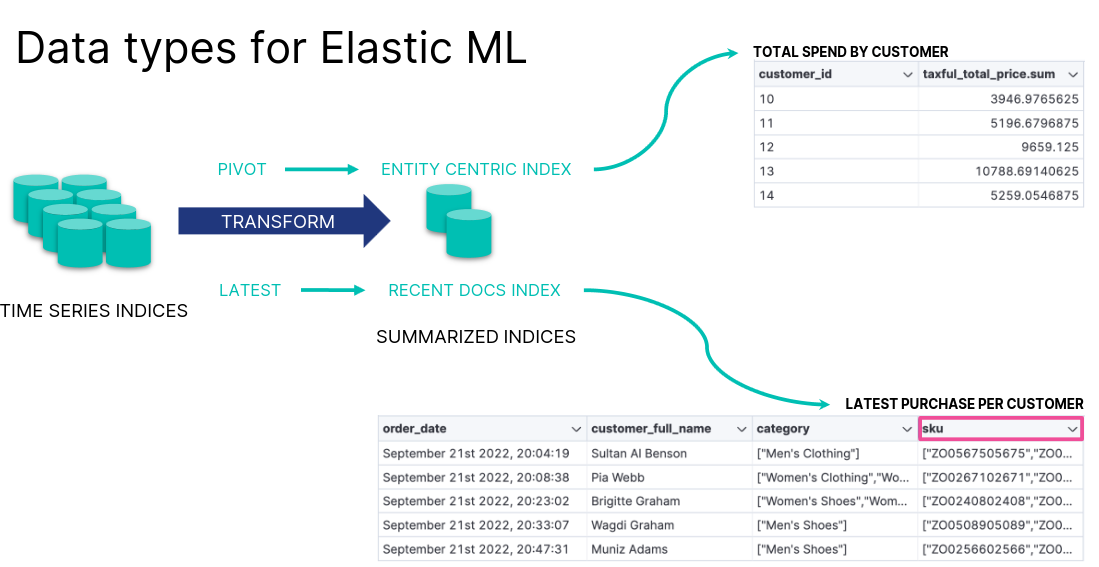
- First, transform the data to a customer-centric index
- Next, detect outliers based on the relevant features
- Select the fields you want to analyze
- Review the results
- Reduce the time to understand your data
- Automate IT operations by leveraging AI and machine learning
- explain log rate spikes
- log pattern analysis
- change point detection
- Identify reasons for increases in log rates
- Find patterns in unstructured log messages
- Detect distribution or trend changes