- Authentication require
- unless you setup anonymous auth
- Also works for
- saved searches
- visualizations
- For a link to latest dashboard state
- select either Saved Objects
- or Snapshot from a saved dashboard
- For a link to current dashboard state
- select Snapshot from an unsaved dashboard
- Embed dashboard as HTML code
- internal company website / web page
- For user with no Kibana access
- enable Kibana anonymous auth
xpack.security.sameSiteCookies: None
- A dashboard may also be shared as a report
- PDF for printing
- PNG for presentations
- Once created, the report will be available in Stack Managemnet
- The POST URL can also be used to create scheduled reporting
- Reports can be Downloaded and Deleted
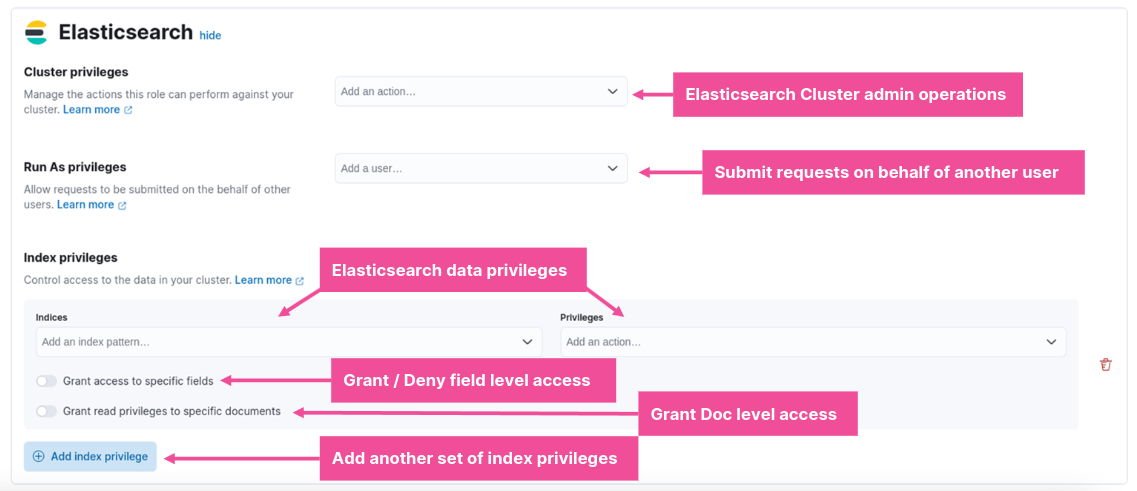
- Role-based access control
- Kibana features
- analytics
- management
- solutions
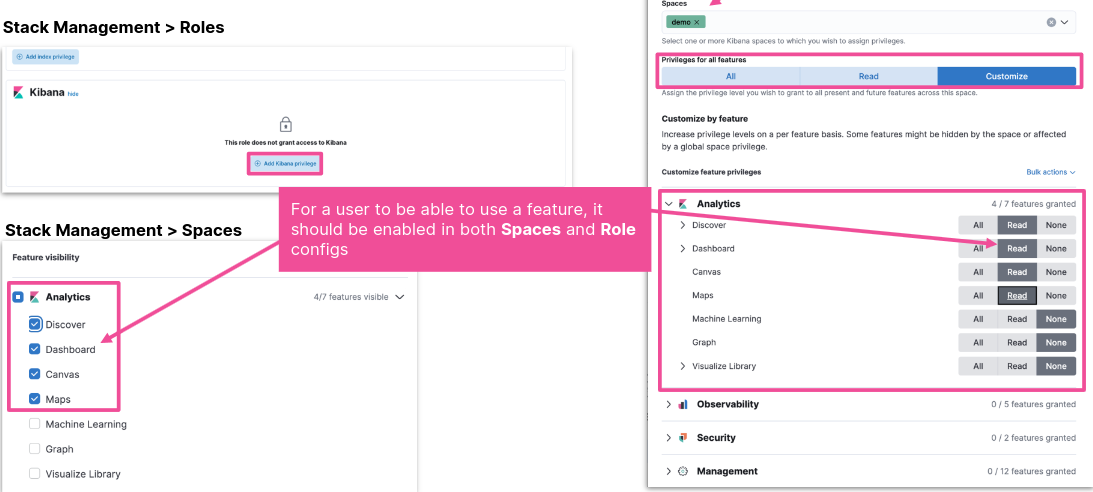
- Granted through config
- Create a space
- Share Dashboard
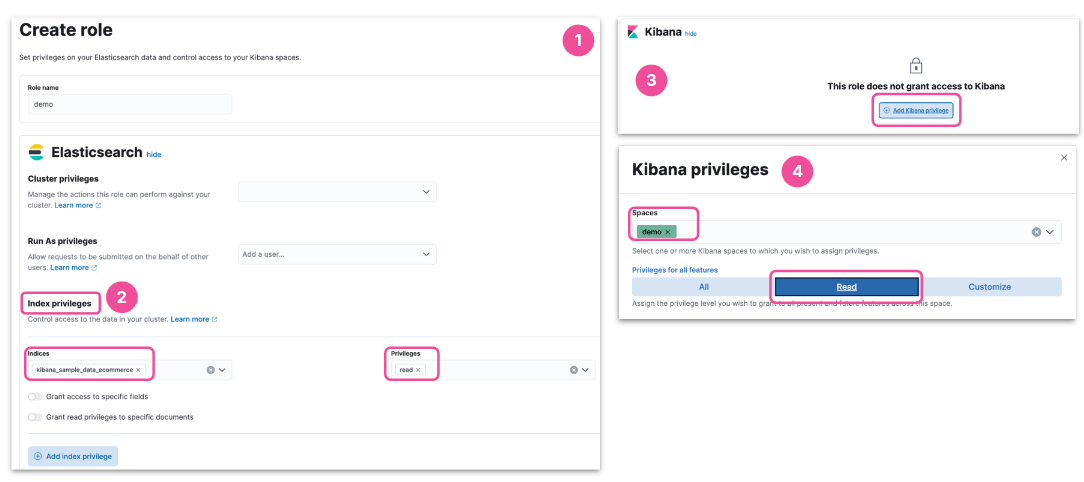
- Create a role with read privileges
- in the new space
- for relevant indices
- Assign user to the new role
- Go to the Spaces Manager from
- Spaces Menu -> Manage spaces
- Main menu -> Stack management -> Spaces
- Enable / Disable features
- Dashboard is under Analytics
- Stack Management -> Saved Objects
- Actions -> Copy to spaces
- Select a space
- Copy to space
- Related objects will also be copied
- Data views
- Saved searches
- Visualizations
- Stack Management -> Users
- Assign the Role to a User
- The new user will be able to access the new space with the shared dashboard
- Provide limited access in existing space
- Create a role with limited privileges
- in existing space
- for relevant indices
- Assign user to the new role
- Give users access to Kibana without requiring creds
- making it easier to share specific dashboards for example
- Beware! All access to Kibana will be anonymous
- make sure you restrict what the anonymous users can access
- Pull live data
- Present using rich infographics
- colors, images, text
- charts, graphs, progress monitor
- Focus the data you want to display
- To get started with Canvas:
- click “Canvas” from the Kibana main menu
- “Create workpad”, optionally using a “Template”
- click “Add element” in the top left
- Elements can be placed anywhere and resized to achieve the desired layout
- Static content, like text and images, are simple to add
- Any visualization that is saved to the library may be added as a Kibana element
- Canvas support many familiar elements
- And also some that are unique to Canvas
- Every Canvas element has a data source
- Several types of data source are supported:
- ES SQL: data in ES, accessed using the ES SQL syntax
- ES documents: data in ES, using the Lucene syntax
- Demo data: small sample dataset that is used when you first create a new template
- Timelion: data in ES, using the Timelion syntax
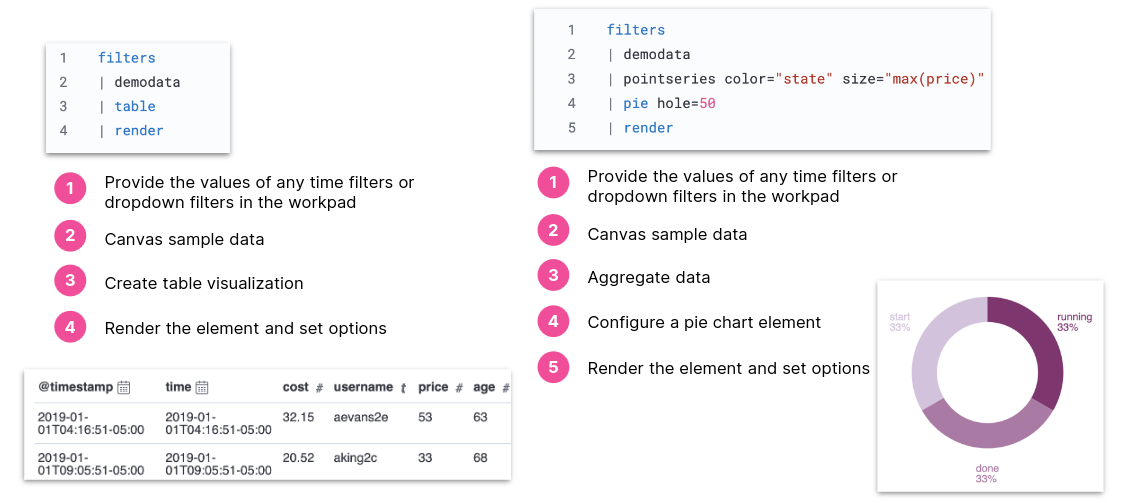
- Defines how to
- retrieve data
- manipulate
- visualize in element
- Executes functions
- produces outputs
- passed on to next function
- Export a Workpad to PDF to generate a report with rich infographics