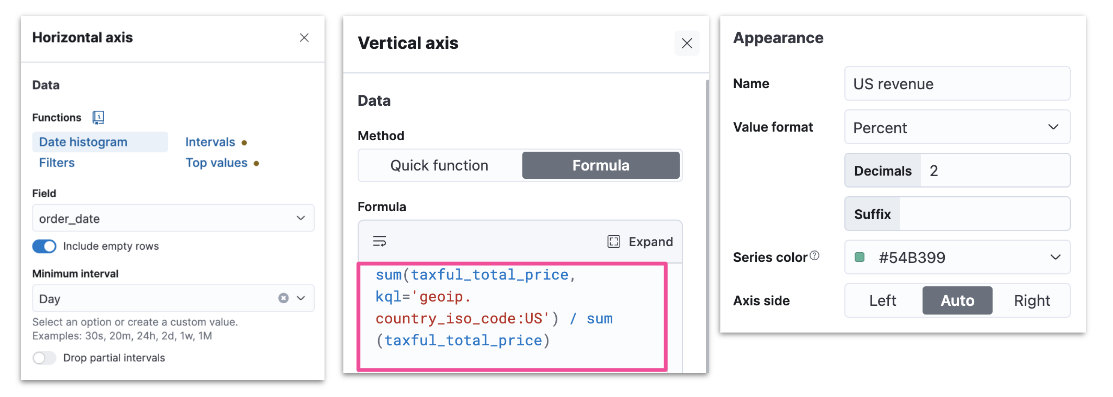
- Divide two values to produce a percent
- Metric for subset of docs over entire dataset
- This week metric over last week metric
- Metric for individual group over all groups
- ES metrics
- average, min, max, sum, etc
- Time series functions that use ES metrics
- cumulative_sum, moving_average, etc
- Math functions
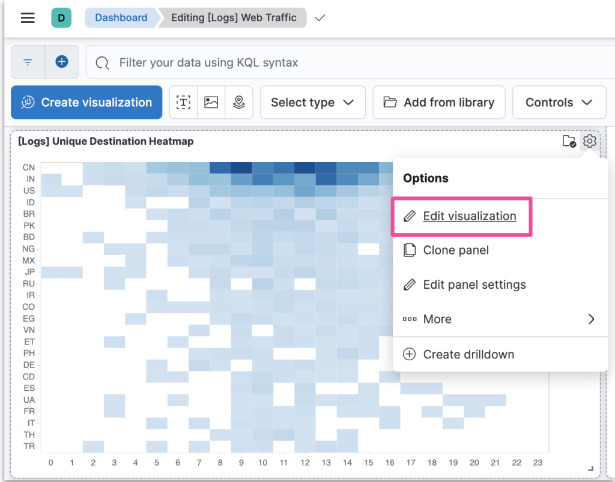
- Pick and edit dashboard
- Edit lens
- Understand context
- Examine formula
- ES stores data in indices
- Kibana queries data stored in ES indices
- To run fast queries ES uses structured data by default
- There are some situations that require querying unstructured data
- Add fields to existing documents without reindexing your data
- Work with your data without understanding how it’s structured
- Override the value returned from an indexed field at query time
- Define fields for a specific use without modifying its structure
- ES uses schema on write by default
- All fields in a document are indexed upon ingest
- Runtime fields allow ES to also support schema on read
- Data can be quickly ingested in raw form without any indexing
- Except for certain necessary fields such as timestamp or response codes
- Other fields can be created on the fly when queries are run against the data
- Applied during data storage
- Better search performance
- Need to know data structure before writing
- Not flexible as the schema cannot be changed
- Applied during data retrieval
- Better write perfomance
- No need to know data structure before writing
- More flexible as the schema can be changed
- Use Painless scripts to
- retrieve a value of fields in doc
- compute something on the fly
- to emit a value into a field
- Use the created field in
- Can impact Kibana performance
- Provide a name
- Define the output type
- Optionally customize how to display your runtime field in Kibana
- Define a Painless script to compute a value
- Optionally set a format to display the runtime field in the way you like
- Save your runtime field when it looks good
- You can preview any documents you want through the arrows
- Benefits
- Add fields after ingest
- Does not increase index size
- Increases ingestion speed
- Readily available for use
- Promotable to indexed field
- Compromises
- Can impact search performance
- Index frequently searched fields
- Balance performance and flexibility
- indexed fields + runtime fields
- Vega
- Open source visualization grammar
- Declarative language for visualization
- Uses JSON for describing
- Vega-Lite
- Higher level language
- Built on top of Vega
- Used to rapidly create common statistical graphics
- Panel can use data from
- ES
- Elastic Map Service
- URL
- Static data
- Kibana panel supports HJSON, though both Vega-Lite and Vega use JSON
- Visit the Vega-Lite example gallery: http://vega.github.io/vega-lite/examples
- Select any example to see its JSON specification
- To see the visualization in Vega or Vega-Lite in Kibana
- copy the JSON specification of a Vega-Lite example
- create a new custom visualization in Kibana
- paste the specification in the editor
- click “Update”
- Use the data clause to retrieve data from ES
- Specify a url clause with a
%timefield%, index, and body
- And a format clause with a property
"data": {
    "url": {
        "%timefield%": "...",
        "index": "...",
        "body": {
            ...
        }
    },
    "format": {
        "property": "..."
    }
}
- Color intensity shows the number of unique visitors
- X-axis shows daily hours
- Y-axis shows countries
- You can check the JSON used to create the custom visualization
body: {
    aggs: {
        countries: {
            terms: {
                field: geo.dest
                size: 25
            }
            aggs: {
                hours: {
                    histogram: {
                        field: hour_of_day
                        interval: 1
                    }
                aggs: {
                    unique: {
                        cardinality: {
                            field: clientip
    ...
    size: 0
}
transform: [
    {
        flatten: ["hours.buckets"],
        as: ["buckets"]
    },
    {
        filter: "datum.buckets.unique.value > 0"
    }
]

mark: {
    type: rect
    tooltip: {
        expr: "{
            \"Unique Visitors\": datum.buckets.unique.value,
            \"geo.src\": datum.key,
            \"Hour\": datum.buckets.key}"
    }
}
    encoding: {
        x: {
            field: buckets.key
            type: nominal
            scale: {
                domain: {
                    expr: "sequence(0, 24)"
                }
            }
            axis: {
                title: false
                labelAngle: 0
            }
        },
        y: {
            field: key
            type: nominal
            sort: {
                field: -buckets.unique.value
            }
            axis: {title: false}
        },
        color: {
            field: buckets.unique.value
            type: quantitative
            axis: {title: false}
            scale: {
                    scheme: blues
            }
        },
}
- Relies on tokens to render data dynamically based on Dashboard filters
url: {
    ...
    %timefield%: @timestamp
    ...
    %context%: true
    index: ...
    body: {
        ...
        range: {
            @timestamp: {
                ...
                "%timefilter%": true
                ...
}